Water Supply Plan - City of Miami
Water Supply Plan - City of Miami
Water Supply Plan - City of Miami

You also want an ePaper? Increase the reach of your titles
YUMPU automatically turns print PDFs into web optimized ePapers that Google loves.
A 4-1<br />
KM2740.Sec4.doc<br />
11/26/2007<br />
Section 4<br />
Population and <strong>Water</strong> Demand Projections<br />
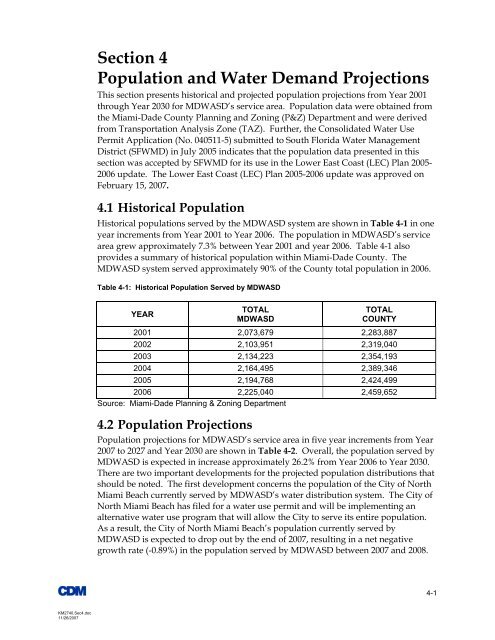
This section presents historical and projected population projections from Year 2001<br />
through Year 2030 for MDWASD’s service area. Population data were obtained from<br />
the <strong>Miami</strong>-Dade County <strong>Plan</strong>ning and Zoning (P&Z) Department and were derived<br />
from Transportation Analysis Zone (TAZ). Further, the Consolidated <strong>Water</strong> Use<br />
Permit Application (No. 040511-5) submitted to South Florida <strong>Water</strong> Management<br />
District (SFWMD) in July 2005 indicates that the population data presented in this<br />
section was accepted by SFWMD for its use in the Lower East Coast (LEC) <strong>Plan</strong> 2005-<br />
2006 update. The Lower East Coast (LEC) <strong>Plan</strong> 2005-2006 update was approved on<br />
February 15, 2007.<br />
4.1 Historical Population<br />
Historical populations served by the MDWASD system are shown in Table 4-1 in one<br />
year increments from Year 2001 to Year 2006. The population in MDWASD’s service<br />
area grew approximately 7.3% between Year 2001 and year 2006. Table 4-1 also<br />
provides a summary <strong>of</strong> historical population within <strong>Miami</strong>-Dade County. The<br />
MDWASD system served approximately 90% <strong>of</strong> the County total population in 2006.<br />
Table 4-1: Historical Population Served by MDWASD<br />
YEAR<br />
TOTAL<br />
MDWASD<br />
TOTAL<br />
COUNTY<br />
2001 2,073,679 2,283,887<br />
2002 2,103,951 2,319,040<br />
2003 2,134,223 2,354,193<br />
2004 2,164,495 2,389,346<br />
2005 2,194,768 2,424,499<br />
2006 2,225,040 2,459,652<br />
Source: <strong>Miami</strong>-Dade <strong>Plan</strong>ning & Zoning Department<br />
4.2 Population Projections<br />
Population projections for MDWASD’s service area in five year increments from Year<br />
2007 to 2027 and Year 2030 are shown in Table 4-2. Overall, the population served by<br />
MDWASD is expected in increase approximately 26.2% from Year 2006 to Year 2030.<br />
There are two important developments for the projected population distributions that<br />
should be noted. The first development concerns the population <strong>of</strong> the <strong>City</strong> <strong>of</strong> North<br />
<strong>Miami</strong> Beach currently served by MDWASD’s water distribution system. The <strong>City</strong> <strong>of</strong><br />
North <strong>Miami</strong> Beach has filed for a water use permit and will be implementing an<br />
alternative water use program that will allow the <strong>City</strong> to serve its entire population.<br />
As a result, the <strong>City</strong> <strong>of</strong> North <strong>Miami</strong> Beach’s population currently served by<br />
MDWASD is expected to drop out by the end <strong>of</strong> 2007, resulting in a net negative<br />
growth rate (-0.89%) in the population served by MDWASD between 2007 and 2008.