September - Tata AIA Life Insurance
September - Tata AIA Life Insurance
September - Tata AIA Life Insurance

You also want an ePaper? Increase the reach of your titles
YUMPU automatically turns print PDFs into web optimized ePapers that Google loves.
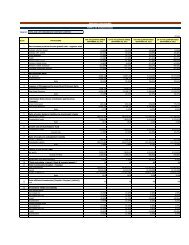
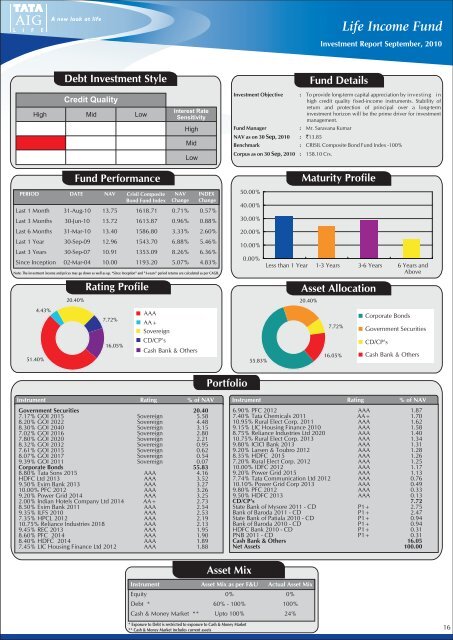
<strong>Life</strong> Income FundInvestment Report <strong>September</strong>, 2010Debt Investment StyleCredit QualityHigh Mid LowInterest RateSensitivityHighMidLowInvestment Objective :Fund ManagerNAV as on 30 Sep, 2010 : `13.85Fund DetailsTo provide long-term capital appreciation by investing inhigh credit quality fixed-income instruments. Stability ofreturn and protection of principal over a long-terminvestment horizon will be the prime driver for investmentmanagement.: Mr. Saravana KumarBenchmark : CRISIL Composite Bond Fund Index -100%Corpus as on 30 Sep, 2010: 158.10 Crs.Fund PerformancePERIOD DATE NAV Crisil Composite NAV INDEXBond Fund Index Change ChangeLast 1 Month 31-Aug-10 13.75 1618.71 0.71% 0.57%Last 3 Months 30-Jun-10 13.72 1613.87 0.96% 0.88%Last 6 Months 31-Mar-10 13.40 1586.80 3.33% 2.60%Last 1 Year 30-Sep-09 12.96 1543.70 6.88% 5.46%Last 3 Years 30-Sep-07 10.91 1353.09 8.26% 6.36%Since Inception 02-Mar-04 10.00 1193.20 5.07% 4.83%Note: The investment income and prices may go down as well as up. “Since Inception” and "3-years" period returns are calculated as per CAGR.4.43%20.40%Rating Profile7.72%16.05%AAAAA+SovereignCD/CP'sCash Bank & OthersPortfolioInstrument Rating % of NAV Instrument Rating % of NAVGovernment Securities 20.407.17% GOI 2015 Sovereign 5.588.20% GOI 2022 Sovereign 4.488.30% GOI 2040 Sovereign 3.157.02% GOI 2016 Sovereign 2.807.80% GOI 2020 Sovereign 2.218.32% GOI 2032 Sovereign 0.957.61% GOI 2015 Sovereign 0.628.07% GOI 2017 Sovereign 0.549.39% GOI 2011 Sovereign 0.07Corporate Bonds 55.838.80% <strong>Tata</strong> Sons 2015 AAA 4.16HDFC Ltd 2013 AAA 3.529.50% Exim Bank 2013 AAA 3.2710.00% PFC 2012 AAA 3.269.20% Power Grid 2014 AAA 3.252.00% Indian Hotels Company Ltd 2014 AA+ 2.738.50% Exim Bank 2011 AAA 2.549.35% ILFS 2010 AAA 2.537.35% HPCL 2012 AAA 2.1910.75% Reliance Industries 2018 AAA 2.139.45% REC 2013 AAA 1.958.60% PFC 2014 AAA 1.908.40% HDFC 2014 AAA 1.897.45% LIC Housing Finance Ltd 2012 AAA 1.8850.00%40.00%30.00%20.00%10.00%0.00%51.40% 55.83%Maturity ProfileLess than 1 Year 1-3 Years 3-6 Years 6 Years andAboveAsset Allocation20.40%7.72%16.05%Corporate BondsGovernment SecuritiesCD/CP'sCash Bank & Others6.90 % PFC 2012 AAA 1.877.40% <strong>Tata</strong> Chemicals 2011 AA+ 1.7010.95% Rural Elect Corp. 2011 AAA 1.629.15% LIC Housing Finance 2010 AAA 1.588.75% Reliance Industries Ltd 2020 AAA 1.4010.75% Rural Elect Corp. 2013 AAA 1.349.80% ICICI Bank 2013 AAA 1.319.20% Larsen & Toubro 2012 AAA 1.288.35% HDFC 2015 AAA 1.267.20% Rural Elect Corp. 2012 AAA 1.2510.00% IDFC 2012 AAA 1.179.20% Power Grid 2015 AAA 1.137.74% <strong>Tata</strong> Communication Ltd 2012 AAA 0.7610.10% Power Grid Corp 2013 AAA 0.499.80% PFC 2012 AAA 0.339.50% HDFC 2013 AAA 0.13CD/CP's 7.72State Bank of Mysore 2011 - CD P1+ 2.75Bank of Baroda 2011 - CD P1+ 2.47State Bank of Patiala 2010 - CD P1+ 0.94Bank of Baroda 2010 - CD P1+ 0.94HDFC Bank 2010 - CD P1+ 0.31PNB 2011 - CD P1+ 0.31Cash Bank & Others 16.05Net Assets 100.00Asset MixInstrument Asset Mix as per F&U Actual Asset MixEquity 0% 0%Debt * 60% - 100% 100%Cash & Money Market ** Upto 100% 24%* Exposure to Debt is restricted to exposure to Cash & Money Market** Cash & Money Market includes current assets16