September - Tata AIA Life Insurance
September - Tata AIA Life Insurance
September - Tata AIA Life Insurance

Create successful ePaper yourself
Turn your PDF publications into a flip-book with our unique Google optimized e-Paper software.
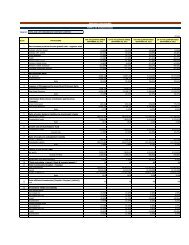
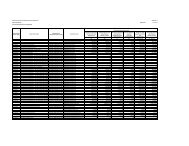
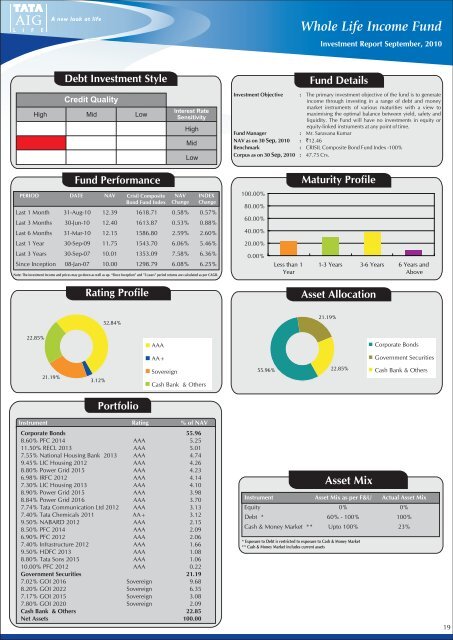
Whole <strong>Life</strong> Income FundInvestment Report <strong>September</strong>, 2010Debt Investment StyleCredit QualityHigh Mid LowInterest RateSensitivityHighMidLowFund DetailsInvestment Objective : The primary investment objective of the fund is to generateincome through investing in a range of debt and moneymarket instruments of various maturities with a view tomaximising the optimal balance between yield, safety andliquidity. The Fund will have no investments in equity orequity-linked instruments at any point of time.Fund Manager: Mr. Saravana KumarNAV as on 30 Sep, 2010 : `12.46Benchmark : CRISIL Composite Bond Fund Index -100%Corpus as on 30 Sep, 2010 : 47.75 Crs.Fund PerformancePERIOD DATE NAV Crisil CompositeBond Fund IndexNAVChangeINDEXChangeLast 1 Month 31-Aug-10 12.39 1618.71 0.58% 0.57%Last 3 Months 30-Jun-10 12.40 1613.87 0.53% 0.88%Last 6 Months 31-Mar-10 12.15 1586.80 2.59% 2.60%Last 1 Year 30-Sep-09 11.75 1543.70 6.06% 5.46%Last 3 Years 30-Sep-07 10.01 1353.09 7.58% 6.36%Since Inception 08-Jan-07 10.00 1298.79 6.08% 6.25%Note: The investment income and prices may go down as well as up. “Since Inception” and "3-years" period returns are calculated as per CAGR.Rating Profile100.00%80.00%60.00%40.00%20.00%0.00%Less than 1YearMaturity Profile1-3 Years 3-6 Years 6 Years andAboveAsset Allocation52.84%21.19%22.85%AAACorporate BondsAA+Government Securities21.19%3.12%SovereignCash Bank & Others55.96%22.85%Cash Bank & OthersPortfolioInstrument Rating % of NAVCorporate Bonds 55.968.60% PFC 2014 AAA 5.2511.50% RECL 2013 AAA 5.017.55% National Housing Bank 2013 AAA 4.749.45% LIC Housing 2012 AAA 4.268.80% Power Grid 2015 AAA 4.236.98% IRFC 2012 AAA 4.147.30% LIC Housing 2013 AAA 4.108.90% Power Grid 2015 AAA 3.988.84% Power Grid 2016 AAA 3.707.74% <strong>Tata</strong> Communication Ltd 2012 AAA 3.137.40% <strong>Tata</strong> Chemicals 2011 AA+ 3.129.50% NABARD 2012 AAA 2.158.50% PFC 2014 AAA 2.096.90% PFC 2012 AAA 2.067.40% Infrastructure 2012 AAA 1.669.50% HDFC 2013 AAA 1.088.80% <strong>Tata</strong> Sons 2015 AAA 1.0610.00% PFC 2012 AAA 0.22Government Securities 21.197.02% GOI 2016 Sovereign 9.688.20% GOI 2022 Sovereign 6.357.17% GOI 2015 Sovereign 3.087.80% GOI 2020 Sovereign 2.09Cash Bank & Others 22.85Net Assets 100.00Asset MixInstrument Asset Mix as per F&U Actual Asset MixEquity 0% 0%Debt * 60% - 100% 100%Cash & Money Market ** Upto 100% 23%* Exposure to Debt is restricted to exposure to Cash & Money Market** Cash & Money Market includes current assets19