September - Tata AIA Life Insurance
September - Tata AIA Life Insurance
September - Tata AIA Life Insurance

Create successful ePaper yourself
Turn your PDF publications into a flip-book with our unique Google optimized e-Paper software.
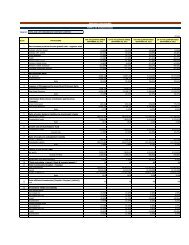
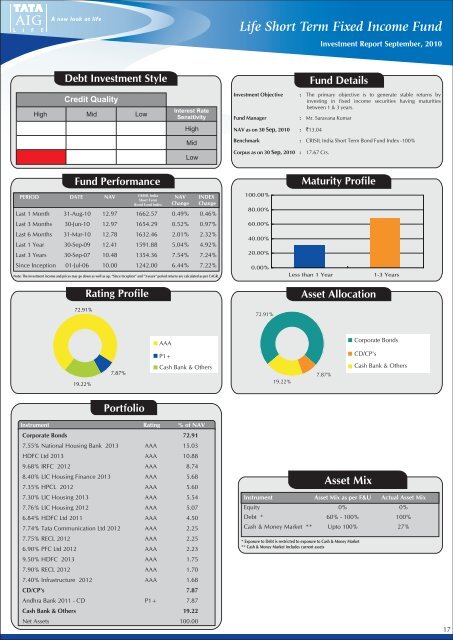
<strong>Life</strong> Short Term Fixed Income FundInvestment Report <strong>September</strong>, 2010Debt Investment StyleCredit QualityHigh Mid LowInterest RateSensitivityHighMidLowInvestment Objective :Fund ManagerNAV as on 30 Sep, 2010 : `13.04Fund DetailsThe primary objective is to generate stable returns byinvesting in fixed income securities having maturitiesbetween 1 & 3 years.: Mr. Saravana KumarBenchmark : CRISIL India Short Term Bond Fund Index -100%Corpus as on 30 Sep, 2010: 17.67 Crs.Fund PerformancePERIOD DATE NAVCRISIL IndiaNAV INDEXChange ChangeShort TermBond Fund IndexLast 1 Month 31-Aug-10 12.97 1662.57 0.49% 0.46%Last 3 Months 30-Jun-10 12.97 1654.29 0.52% 0.97%Last 6 Months 31-Mar-10 12.78 1632.46 2.01% 2.32%Last 1 Year 30-Sep-09 12.41 1591.88 5.04% 4.92%Last 3 Years 30-Sep-07 10.48 1354.36 7.54% 7.24%Since Inception 01-Jul-06 10.00 1242.00 6.44% 7.22%Note: The investment income and prices may go down as well as up. “Since Inception” and "3-years" period returns are calculated as per CAGR.72.91%Rating Profile100.00%80.00%60.00%40.00%20.00%0.00%72.91%Maturity ProfileLess than 1 Year1-3 YearsAsset AllocationAAACorporate BondsP1+CD/CP's19.22%7.87%Cash Bank & Others19.22%7.87%Cash Bank & OthersPortfolioInstrument Rating % of NAVCorporate Bonds 72.917.55% National Housing Bank 2013 AAA 15.03HDFC Ltd 2013 AAA 10.889.68% IRFC 2012 AAA 8.748.40% LIC Housing Finance 2013 AAA 5.687.35% HPCL 2012 AAA 5.607.30% LIC Housing 2013 AAA 5.547.76% LIC Housing 2012 AAA 5.076.84% HDFC Ltd 2011 AAA 4.507.74% <strong>Tata</strong> Communication Ltd 2012 AAA 2.257.75% RECL 2012 AAA 2.256.90% PFC Ltd 2012 AAA 2.239.50% HDFC 2013 AAA 1.757.90% RECL 2012 AAA 1.707.40% Infrastructure 2012 AAA 1.68CD/CP's 7.87Andhra Bank 2011 - CD P1+ 7.87Cash Bank & Others 19.22Net Assets 100.00Asset MixInstrument Asset Mix as per F&U Actual Asset MixEquity 0% 0%Debt * 60% - 100% 100%Cash & Money Market ** Upto 100% 27%* Exposure to Debt is restricted to exposure to Cash & Money Market** Cash & Money Market includes current assets17