September - Tata AIA Life Insurance
September - Tata AIA Life Insurance
September - Tata AIA Life Insurance

You also want an ePaper? Increase the reach of your titles
YUMPU automatically turns print PDFs into web optimized ePapers that Google loves.
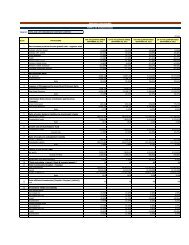
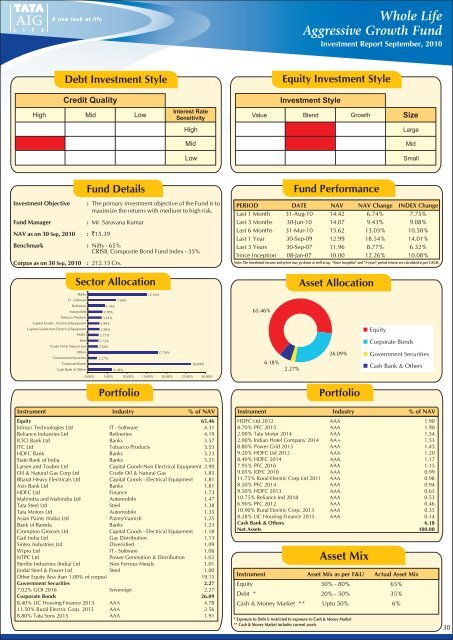
Whole <strong>Life</strong>Aggressive Growth FundInvestment Report <strong>September</strong>, 2010Debt Investment StyleEquity Investment StyleCredit QualityInvestment StyleHigh Mid LowInterest RateSensitivityValue Blend GrowthSizeHighLargeMidMidLowSmallFund DetailsInvestment Objective : The primary investment objective of the Fund is tomaximize the returns with medium to high risk.Fund ManagerNAV as on 30 Sep, 2010 : `15.39: Mr. Saravana KumarBenchmark : Nifty - 65%CRISIL Composite Bond Fund Index - 35%Corpus as on 30 Sep, 2010: 212.13 Crs.Fund PerformancePERIOD DATE NAV NAV Change INDEX ChangeLast 1 Month 31-Aug-10 14.42 6.74% 7.75%Last 3 Months 30-Jun-10 14.07 9.43% 9.08%Last 6 Months 31-Mar-10 13.62 13.03% 10.58%Last 1 Year 30-Sep-09 12.99 18.54% 14.01%Last 3 Years 30-Sep-07 11.96 8.77% 6.32%Since Inception 08-Jan-07 10.00 12.26% 10.08%Note: The investment income and prices may go down as well as up. “Since Inception” and "3-years" period returns are calculated as per CAGR.Sector AllocationBanks15.10%IT - Software7.09%RefineriesAutomobileTobacco ProductsCapital Goods - Electrical EquipmentCapital Goods-Non Electrical EquipmentFMCGSteelCrude Oil & Natural Gas4.19%3.78%3.53%2.99%2.96%2.77%2.72%2.56%Others17.76%Government Securities 2.27%Corporate Bonds26.09%Cash Bank & Others6.18%0.00% 5.00% 10.00% 15.00% 20.00% 25.00% 30.00%Portfolio65.46%6.18%Asset AllocationEquityCorporate Bonds26.09% Government Securities2.27%Cash Bank & OthersPortfolioInstrument Industry % of NAVEquity 65.46Infosys Technologies Ltd IT - Software 4.31Reliance Industries Ltd Refineries 4.19ICICI Bank Ltd Banks 3.57ITC Ltd Tobacco Products 3.53HDFC Bank Banks 3.23State Bank of India Banks 3.21Larsen and Toubro Ltd Capital Goods-Non Electrical Equipment 2.90Oil & Natural Gas Corp Ltd Crude Oil & Natural Gas 1.85Bharat Heavy Electricals Ltd Capital Goods - Electrical Equipment 1.81Axis Bank Ltd Banks 1.81HDFC Ltd Finance 1.73Mahindra and Mahindra Ltd Automobile 1.47<strong>Tata</strong> Steel Ltd Steel 1.38<strong>Tata</strong> Motors Ltd Automobile 1.35Asian Paints (India) Ltd Paints/Varnish 1.25Bank of Baroda Banks 1.23Crompton Greaves Ltd Capital Goods - Electrical Equipment 1.18Gail India Ltd Gas Distribution 1.13Sintex Industries Ltd Diversified 1.09Wipro Ltd IT - Software 1.06NTPC Ltd Power Generation & Distribution 1.02Sterlite Industries (India) Ltd Non Ferrous Metals 1.01Jindal Steel & Power Ltd Steel 1.00Other Equity (less than 1.00% of corpus) 19.15Government Securities 2.277.02% GOI 2016 Sovereign 2.27Corporate Bonds 26.098.40% LIC Housing Finance 2013 AAA 4.7811.50% Rural Electric Corp. 2013 AAA 2.568.80% <strong>Tata</strong> Sons 2015 AAA 1.91Instrument Industry % of NAVHDFC Ltd 2012 AAA 1.908.70% PFC 2015 AAA 1.902.00% <strong>Tata</strong> Motor 2014 AAA 1.542.00% Indian Hotel Company 2014 AA+ 1.538.80% Power Grid 2015 AAA 1.439.20% HDFC Ltd 2012 AAA 1.208.40% HDFC 2014 AAA 1.177.95% PFC 2016 AAA 1.159.05% IDFC 2010 AAA 0.9911.75% Rural Electric Corp Ltd 2011 AAA 0.988.50% PFC 2014 AAA 0.949.50% HDFC 2013 AAA 0.6310.75% Reliance Ind 2018 AAA 0.536.90% PFC 2012 AAA 0.4610.90% Rural Electric Corp. 2013 AAA 0.358.28% LIC Housing Finance 2015 AAA 0.14Cash Bank & Others 6.18Net Assets 100.00Asset MixInstrument Asset Mix as per F&U Actual Asset MixEquity 50% - 80%65%Debt * 20% - 50% 35%Cash & Money Market ** Upto 50% 6%* Exposure to Debt is restricted to exposure to Cash & Money Market** Cash & Money Market includes current assets30