September - Tata AIA Life Insurance
September - Tata AIA Life Insurance
September - Tata AIA Life Insurance

Create successful ePaper yourself
Turn your PDF publications into a flip-book with our unique Google optimized e-Paper software.
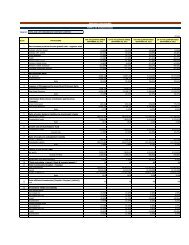
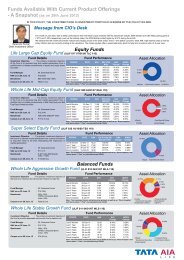
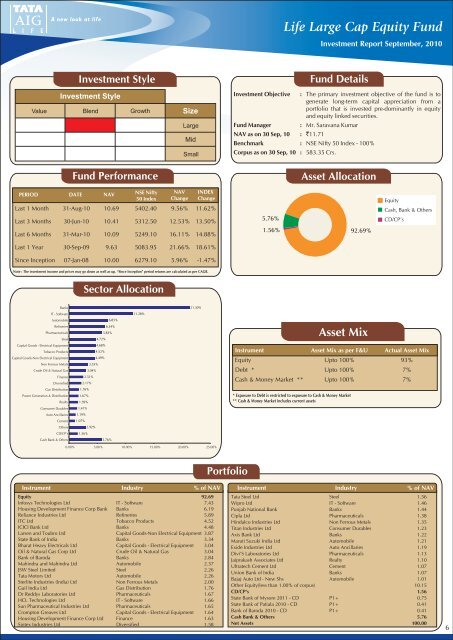
<strong>Life</strong> Large Cap Equity FundInvestment Report <strong>September</strong>, 2010Investment StyleInvestment StyleValue Blend GrowthFund PerformanceSizeLargeMidSmallInvestment Objective :Fund ManagerNAV as on 30 Sep, 10 : `11.71Fund DetailsThe primary investment objective of the fund is togenerate long-term capital appreciation from aportfolio that is invested pre-dominantly in equityand equity linked securities.: Mr. Saravana KumarBenchmark : NSE Nifty 50 Index - 100%Corpus as on 30 Sep, 10 : 583.35 Crs.Asset AllocationPERIOD DATE NAVNSE Nifty50 IndexNAVChangeINDEXChangeLast 1 Month 31-Aug-10 10.69 5402.40 9.56% 11.62%Last 3 Months 30-Jun-10 10.41 5312.50 12.53% 13.50%Last 6 Months 31-Mar-10 10.09 5249.10 16.11% 14.88%5.76%1.56%92.69%EquityCash, Bank & OthersCD/CP’sLast 1 Year 30-Sep-09 9.63 5083.95 21.66% 18.61%Since Inception 07-Jan-08 10.00 6279.10 5.96% -1.47%Note : The investment income and prices may go down as well as up. “Since Inception” period returns are calculated as per CAGR.Sector AllocationBanks21.30%IT - Software11.28%AutomobileRefineriesPharmaceuticalsSteel6.85%6.34%5.83%4.72%Asset MixCapital Goods - Electrical EquipmentTobacco ProductsCapital Goods-Non Electrical EquipmentNon Ferrous MetalsCrude Oil & Natural GasFinanceDiversified4.68%4.52%4.49%3.35%3.04%2.51%2.17%Instrument Asset Mix as per F&U Actual Asset MixEquity Upto 100%93%Debt * Upto 100%7%Cash & Money Market ** Upto 100% 7%Gas DistributionPower Generation & DistributionRealty1.76%1.67%1.59%* Exposure to Debt is restricted to exposure to Cash & Money Market** Cash & Money Market includes current assetsConsumer Durables1.41%Auto Ancillaries1.19%Cement1.07%Others2.92%CD/CP's1.56%Cash Bank & Others5.76%0.00% 5.00% 10.00% 15.00% 20.00% 25.00%PortfolioInstrument Industry % of NAVEquity 92.69Infosys Technologies Ltd IT - Software 7.43Housing Development Finance Corp Bank Banks 6.19Reliance Industries Ltd Refineries 5.89ITC Ltd Tobacco Products 4.52ICICI Bank Ltd Banks 4.48Larsen and Toubro Ltd Capital Goods-Non Electrical Equipment 3.87State Bank of India Banks 3.34Bharat Heavy Electricals Ltd Capital Goods - Electrical Equipment 3.04Oil & Natural Gas Corp Ltd Crude Oil & Natural Gas 3.04Bank of Baroda Banks 2.84Mahindra and Mahindra Ltd Automobile 2.37JSW Steel Limited Steel 2.26<strong>Tata</strong> Motors Ltd Automobile 2.26Sterlite Industries (India) Ltd Non Ferrous Metals 2.00Gail India Ltd Gas Distribution 1.76Dr Reddys Laboratories Ltd Pharmaceuticals 1.67HCL Technologies Ltd IT - Software 1.66Sun Pharmaceutical Industries Ltd Pharmaceuticals 1.65Crompton Greaves Ltd Capital Goods - Electrical Equipment 1.64Housing Development Finance Corp Ltd Finance 1.63Sintex Industries Ltd Diversified 1.58Instrument Industry % of NAV<strong>Tata</strong> Steel Ltd Steel 1.56Wipro Ltd IT - Software 1.46Punjab National Bank Banks 1.44Cipla Ltd Pharmaceuticals 1.38Hindalco Industries Ltd Non Ferrous Metals 1.35Titan Industries Ltd Consumer Durables 1.23Axis Bank Ltd Banks 1.22Maruti Suzuki India Ltd Automobile 1.21Exide Industries Ltd Auto Ancillaries 1.19Divi'S Laboratories Ltd Pharmaceuticals 1.13Jaiprakash Associates Ltd Realty 1.10Ultratech Cement Ltd Cement 1.07Union Bank of India Banks 1.07Bajaj Auto Ltd - New Shs Automobile 1.01Other Equity(less than 1.00% of corpus) 10.15CD/CP's 1.56State Bank of Mysore 2011 - CD P1+ 0.75State Bank of Patiala 2010 - CD P1+ 0.41Bank of Baroda 2010 - CD P1+ 0.41Cash Bank & Others 5.76Net Assets 100.006