September - Tata AIA Life Insurance
September - Tata AIA Life Insurance
September - Tata AIA Life Insurance

You also want an ePaper? Increase the reach of your titles
YUMPU automatically turns print PDFs into web optimized ePapers that Google loves.
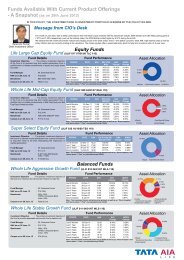
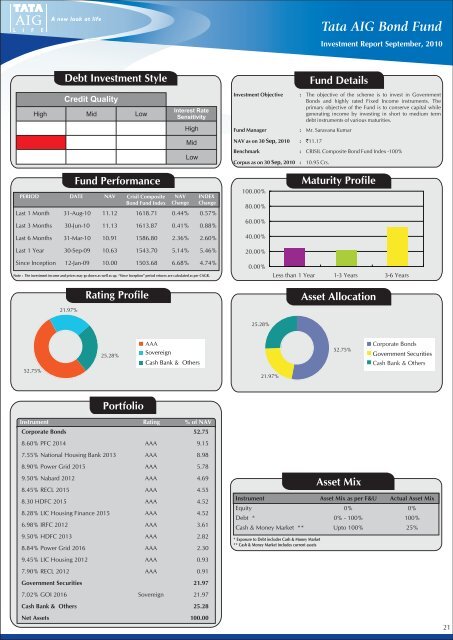
<strong>Tata</strong> AIG Bond FundInvestment Report <strong>September</strong>, 2010Debt Investment StyleCredit QualityHigh Mid LowInterest RateSensitivityHighMidLowInvestment Objective :Fund ManagerNAV as on 30 Sep, 2010 : `11.17Fund DetailsThe objective of the scheme is to invest in GovernmentBonds and highly rated Fixed Income instruments. Theprimary objective of the Fund is to conserve capital whilegenerating income by investing in short to medium termdebt instruments of various maturities.: Mr. Saravana KumarBenchmark : CRISIL Composite Bond Fund Index -100%Corpus as on 30 Sep, 2010: 10.95 Crs.Fund PerformancePERIOD DATE NAV Crisil CompositeBond Fund IndexNAVChangeINDEXChangeLast 1 Month 31-Aug-10 11.12 1618.71 0.44% 0.57%Last 3 Months 30-Jun-10 11.13 1613.87 0.41% 0.88%Last 6 Months 31-Mar-10 10.91 1586.80 2.36% 2.60%Last 1 Year 30-Sep-09 10.63 1543.70 5.14% 5.46%Since Inception 12-Jan-09 10.00 1503.68 6.68% 4.74%Note : The investment income and prices may go down as well as up. “Since Inception” period returns are calculated as per CAGR.100.00%80.00%60.00%40.00%20.00%0.00%Maturity ProfileLess than 1 Year 1-3 Years 3-6 Years21.97%Rating ProfileAsset Allocation25.28%52.75%25.28%AAASovereignCash Bank & Others21.97%52.75%Corporate BondsGovernment SecuritiesCash Bank & OthersPortfolioInstrument Rating % of NAVCorporate Bonds 52.758.60% PFC 2014 AAA 9.157.55% National Housing Bank 2013 AAA 8.988.90% Power Grid 2015 AAA 5.789.50% Nabard 2012 AAA 4.698.45% RECL 2015 AAA 4.558.30 HDFC 2015 AAA 4.528.28% LIC Housing Finance 2015 AAA 4.526.98% IRFC 2012 AAA 3.619.50% HDFC 2013 AAA 2.828.84% Power Grid 2016 AAA 2.309.45% LIC Housing 2012 AAA 0.937.90% RECL 2012 AAA 0.91Government Securities 21.977.02% GOI 2016 Sovereign 21.97Cash Bank & Others 25.28Net Assets 100.00Asset MixInstrument Asset Mix as per F&U Actual Asset MixEquity 0% 0%Debt * 0% - 100% 100%Cash & Money Market ** Upto 100% 25%* Exposure to Debt includes Cash & Money Market** Cash & Money Market includes current assets21