- Page 2 and 3:
Lecture Notes in Computer Science 2
- Page 4 and 5:
Samuel Pierre Michel BarbeauEvangel
- Page 6:
PrefaceAd Hoc Networks are wireless
- Page 9 and 10:
Program CommitteeG. Alonso, ETHZ, S
- Page 11 and 12:
XTable of ContentsResisting Malicio
- Page 13 and 14:
2 H. Dubois-Ferrière, M. Grossglau
- Page 15 and 16:
4 H. Dubois-Ferrière, M. Grossglau
- Page 17 and 18:
6 H. Dubois-Ferrière, M. Grossglau
- Page 19 and 20:
8 H. Dubois-Ferrière, M. Grossglau
- Page 21 and 22:
10 H. Dubois-Ferrière, M. Grossgla
- Page 23 and 24:
SAFAR: An Adaptive Bandwidth-Effici
- Page 25 and 26: 14 J. Doshi and P. Kilambiour proto
- Page 27 and 28: 16 J. Doshi and P. Kilambipacket th
- Page 29 and 30: 18 J. Doshi and P. Kilambibandwidth
- Page 31 and 32: 20 J. Doshi and P. Kilambi5 Simulat
- Page 33 and 34: 22 J. Doshi and P. Kilambiquery its
- Page 35 and 36: 24 J. Doshi and P. Kilambi4. David
- Page 37 and 38: 26 P. Narayan and V.R. SyrotiukThe
- Page 39 and 40: 28 P. Narayan and V.R. Syrotiuk2.2
- Page 41 and 42: 30 P. Narayan and V.R. Syrotiukrand
- Page 43 and 44: 32 P. Narayan and V.R. Syrotiukenti
- Page 45 and 46: 34 P. Narayan and V.R. SyrotiukDSRA
- Page 47 and 48: 36 P. Narayan and V.R. Syrotiuk7. A
- Page 49 and 50: 38 L. Qin and T. Kunzthese two prot
- Page 51 and 52: 40 L. Qin and T. Kunzsidered broken
- Page 53: 42 L. Qin and T. KunzP = Prdlog( )
- Page 57 and 58: 46 L. Qin and T. KunzFig. 5. Averag
- Page 59 and 60: 48 L. Qin and T. Kunz6. J. Broch et
- Page 61 and 62: 50 M. Diha and S. Pierrethe propose
- Page 63 and 64: 52 M. Diha and S. Pierre3. All proc
- Page 65 and 66: 54 M. Diha and S. Pierre3.3 Perform
- Page 67 and 68: 56 M. Diha and S. PierreCmip/Cprop0
- Page 69 and 70: 58 M. Diha and S. PierreThe tunneli
- Page 71 and 72: Proactive QoS Routing in Ad Hoc Net
- Page 73 and 74: 62 Y. Ge, T. Kunz, and L. LamontFig
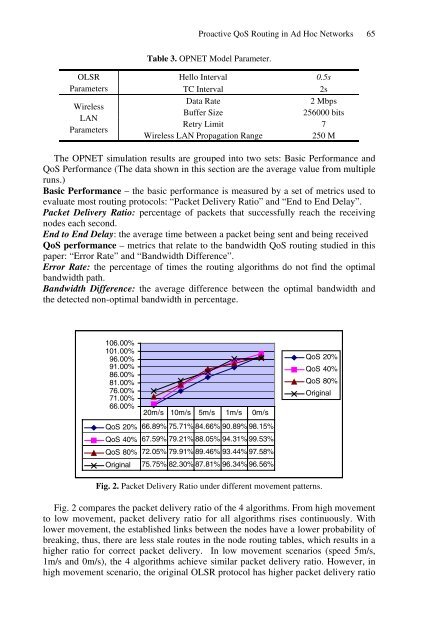
- Page 75: 64 Y. Ge, T. Kunz, and L. Lamontits
- Page 79 and 80: 68 Y. Ge, T. Kunz, and L. Lamontwhi
- Page 81 and 82: 70 Y. Ge, T. Kunz, and L. Lamontver
- Page 83 and 84: Delivering Messagesin Disconnected
- Page 85 and 86: 74 R. Shah and N.C. Hutchinson3.1 T
- Page 87 and 88: 76 R. Shah and N.C. Hutchinsonset c
- Page 89 and 90: 78 R. Shah and N.C. HutchinsonTable
- Page 91 and 92: 80 R. Shah and N.C. HutchinsonOracl
- Page 93 and 94: 82 R. Shah and N.C. Hutchinsonthe r
- Page 95 and 96: Extending Seamless IP Multicast Edg
- Page 97 and 98: 86 P.M. Ruiz et al.Section 4 presen
- Page 99 and 100: 88 P.M. Ruiz et al.Access NetworkCo
- Page 101 and 102: 90 P.M. Ruiz et al.Access NetworkR
- Page 103 and 104: 92 P.M. Ruiz et al.MIGAccess Networ
- Page 105 and 106: 94 P.M. Ruiz et al.10.90.81-hop-750
- Page 107 and 108: A Uniform Continuum Model for Scali
- Page 109 and 110: 98 E.W. Grundke and A.N. Zincir-Hey
- Page 111 and 112: 100 E.W. Grundke and A.N. Zincir-He
- Page 113 and 114: 102 E.W. Grundke and A.N. Zincir-He
- Page 115 and 116: Probabilistic Protocols for Node Di
- Page 117 and 118: 106 G. Alonso et al.A node discover
- Page 119 and 120: 108 G. Alonso et al.frequency alloc
- Page 121 and 122: 110 G. Alonso et al.- D is a diagon
- Page 123 and 124: 112 G. Alonso et al.and therefore,
- Page 125 and 126: 114 G. Alonso et al.complicated. Fo
- Page 127 and 128:
Towards Adaptive WLAN Frequency Man
- Page 129 and 130:
118 F. Gamba, J.-F. Wagen, and D. R
- Page 131 and 132:
120 F. Gamba, J.-F. Wagen, and D. R
- Page 133 and 134:
122 F. Gamba, J.-F. Wagen, and D. R
- Page 135 and 136:
124 F. Gamba, J.-F. Wagen, and D. R
- Page 137 and 138:
126 F. Gamba, J.-F. Wagen, and D. R
- Page 139 and 140:
Analyzing Split Channel Medium Acce
- Page 141 and 142:
130 J. Deng, Y.S. Han, and Z.J. Haa
- Page 143 and 144:
132 J. Deng, Y.S. Han, and Z.J. Haa
- Page 145 and 146:
134 J. Deng, Y.S. Han, and Z.J. Haa
- Page 147 and 148:
136 J. Deng, Y.S. Han, and Z.J. Haa
- Page 149 and 150:
138 J. Deng, Y.S. Han, and Z.J. Haa
- Page 151 and 152:
Preventing Replay Attacks for Secur
- Page 153 and 154:
142 J. Zhen and S. SrinivasTraffic
- Page 155 and 156:
144 J. Zhen and S. SrinivasFig. 2.
- Page 157 and 158:
146 J. Zhen and S. Srinivasbeginnin
- Page 159 and 160:
148 J. Zhen and S. Srinivasthe time
- Page 161 and 162:
150 J. Zhen and S. Srinivas16. Y. H
- Page 163 and 164:
152 M. Just, E. Kranakis, and T. Wa
- Page 165 and 166:
154 M. Just, E. Kranakis, and T. Wa
- Page 167 and 168:
156 M. Just, E. Kranakis, and T. Wa
- Page 169 and 170:
158 M. Just, E. Kranakis, and T. Wa
- Page 171 and 172:
160 M. Just, E. Kranakis, and T. Wa
- Page 173 and 174:
162 M. Just, E. Kranakis, and T. Wa
- Page 175 and 176:
A New Framework for Building Secure
- Page 177 and 178:
166 H.-P. Bischof, A. Kaminsky, and
- Page 179 and 180:
168 H.-P. Bischof, A. Kaminsky, and
- Page 181 and 182:
170 H.-P. Bischof, A. Kaminsky, and
- Page 183 and 184:
172 H.-P. Bischof, A. Kaminsky, and
- Page 185 and 186:
174 H.-P. Bischof, A. Kaminsky, and
- Page 187 and 188:
176 G. Calinescuof the UDG 2-hops a
- Page 189 and 190:
178 G. CalinescuSection 3 describe
- Page 191 and 192:
180 G. CalinescuWhen receiving a pa
- Page 193 and 194:
182 G. CalinescuRyvxFig. 3. The unn
- Page 195 and 196:
184 G. Calinescu< nodeID, pieceID,
- Page 197 and 198:
186 G. Calinescu7. Heinz Breu and D
- Page 199 and 200:
188 S.O. Krumke et al.desirable in
- Page 201 and 202:
190 S.O. Krumke et al.2.2 Bicriteri
- Page 203 and 204:
192 S.O. Krumke et al.1. From the g
- Page 205 and 206:
194 S.O. Krumke et al.The following
- Page 207 and 208:
196 S.O. Krumke et al.1. Let α =6l
- Page 209 and 210:
198 S.O. Krumke et al.for any given
- Page 211 and 212:
200 S. PatilIDEA uses the concept o
- Page 213 and 214:
202 S. PatilAfter flooding the quer
- Page 215 and 216:
204 S. Patil5 Simulation ModelSourc
- Page 217 and 218:
206 S. PatilAvg. Aggregate Energy C
- Page 219 and 220:
208 S. PatilTable 1. Probability of
- Page 221 and 222:
210 S. Patilergy consumption of the
- Page 223 and 224:
212 T. Chu and I. Nikolaidisenergy
- Page 225 and 226:
214 T. Chu and I. Nikolaidisaim at
- Page 227 and 228:
216 T. Chu and I. Nikolaidis12: end
- Page 229 and 230:
218 T. Chu and I. Nikolaidis1.8E+09
- Page 231 and 232:
220 T. Chu and I. Nikolaidis2.0E+10
- Page 233 and 234:
222 T. Chu and I. Nikolaidisattack
- Page 235 and 236:
224 F.J. Molina, J. Barbancho, and
- Page 237 and 238:
226 F.J. Molina, J. Barbancho, and
- Page 239 and 240:
228 F.J. Molina, J. Barbancho, and
- Page 241 and 242:
230 F.J. Molina, J. Barbancho, and
- Page 243 and 244:
232 F.J. Molina, J. Barbancho, and
- Page 245 and 246:
234 F.J. Molina, J. Barbancho, and
- Page 247 and 248:
236 G. Calinescu and P.-J. Wan3.5 4
- Page 249 and 250:
238 G. Calinescu and P.-J. Wanmum s
- Page 251 and 252:
240 G. Calinescu and P.-J. WanFrom
- Page 253 and 254:
242 G. Calinescu and P.-J. Wan5 Alg
- Page 255 and 256:
244 G. Calinescu and P.-J. WanThe n
- Page 257 and 258:
246 G. Calinescu and P.-J. Wan9. A.
- Page 259 and 260:
248 C.J. Colbourn, V.R. Syrotiuk, a
- Page 261 and 262:
250 C.J. Colbourn, V.R. Syrotiuk, a
- Page 263 and 264:
252 C.J. Colbourn, V.R. Syrotiuk, a
- Page 265 and 266:
254 C.J. Colbourn, V.R. Syrotiuk, a
- Page 267 and 268:
256 C.J. Colbourn, V.R. Syrotiuk, a
- Page 269 and 270:
258 C.J. Colbourn, V.R. Syrotiuk, a
- Page 271 and 272:
260 S. Bhadra and A. Ferreirathe mo
- Page 273 and 274:
262 S. Bhadra and A. FerreiraIn thi
- Page 275 and 276:
264 S. Bhadra and A. FerreiraDefini
- Page 277 and 278:
266 S. Bhadra and A. FerreiraThis s
- Page 279 and 280:
268 S. Bhadra and A. FerreiraTheore
- Page 281 and 282:
270 S. Bhadra and A. Ferreira4. T.
- Page 283 and 284:
272 M.K. Denko and Q.H. MahmoudAn i
- Page 285 and 286:
274 M.K. Denko and Q.H. Mahmoud3.1
- Page 287 and 288:
276 M.K. Denko and Q.H. Mahmoud5. D
- Page 289 and 290:
278 B. Macabéo, S. Pierre, and A.
- Page 291 and 292:
280 B. Macabéo, S. Pierre, and A.
- Page 293 and 294:
282 A. Benslimane and A. BachirIn [
- Page 295 and 296:
284 A. Benslimane and A. BachirFig.
- Page 297 and 298:
286 A. Benslimane and A. Bachir5 Co
- Page 299 and 300:
288 L. Hughes, K. Shumon, and Y. Zh
- Page 301 and 302:
290 L. Hughes, K. Shumon, and Y. Zh
- Page 303 and 304:
292 L. Hughes, K. Shumon, and Y. Zh
- Page 305 and 306:
3BerlinHeidelbergNew YorkHong KongL
- Page 307 and 308:
Series EditorsGerhard Goos, Karlsru
- Page 310 and 311:
Organizing CommitteeConference Co-c
- Page 312 and 313:
Table of ContentsSpace-Time Routing
- Page 314:
Author IndexAlonso, G. 104Bachir, A