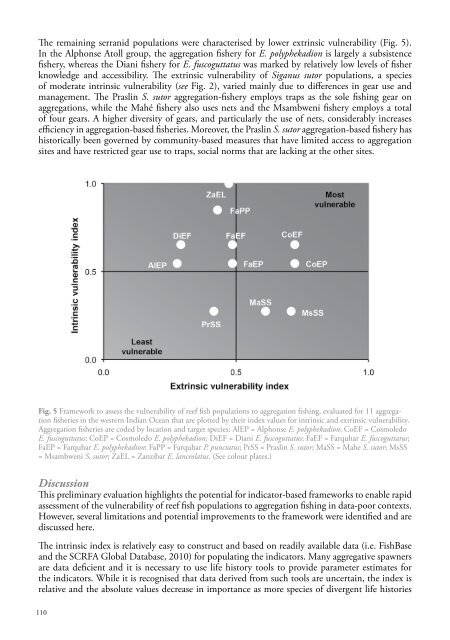
The remaining serranid populations were characterised by lower extrinsic vulnerability (Fig. 5).In the Alphonse Atoll group, the aggregation fishery for E. polyphekadion is largely a subsistencefishery, whereas the Diani fishery for E. fuscoguttatus was marked by relatively low levels of fisherknowledge and accessibility. The extrinsic vulnerability of Siganus sutor populations, a speciesof moderate intrinsic vulnerability (see Fig. 2), varied mainly due to differences in gear use andmanagement. The Praslin S. sutor aggregation-fishery employs traps as the sole fishing gear onaggregations, while the Mahé fishery also uses nets and the Msambweni fishery employs a totalof four gears. A higher diversity of gears, and particularly the use of nets, considerably increasesefficiency in aggregation-based fisheries. Moreover, the Praslin S. sutor aggregation-based fishery hashistorically been governed by community-based measures that have limited access to aggregationsites and have restricted gear use to traps, social norms that are lacking at the other sites.Fig. 5 Framework to assess the vulnerability of reef fish populations to aggregation fishing, evaluated for 11 aggregationfisheries in the western Indian Ocean that are plotted by their index values for intrinsic and extrinsic vulnerability.Aggregation fisheries are coded by location and target species: AlEP = Alphonse E. polyphekadion; CoEF = CosmoledoE. fuscoguttatus; CoEP = Cosmoledo E. polyphekadion; DiEF = Diani E. fuscoguttatus; FaEF = Farquhar E. fuscoguttatus;FaEP = Farquhar E. polyphekadion; FaPP = Farquhar P. punctatus; PrSS = Praslin S. sutor; MaSS = Mahe S. sutor; MsSS= Msambweni S. sutor; ZaEL = Zanzibar E. lanceolatus. (See colour plates.)DiscussionThis preliminary evaluation highlights the potential for indicator-based frameworks to enable rapidassessment of the vulnerability of reef fish populations to aggregation fishing in data-poor contexts.However, several limitations and potential improvements to the framework were identified and arediscussed here.The intrinsic index is relatively easy to construct and based on readily available data (i.e. FishBaseand the SCRFA Global Database, 20<strong>10</strong>) for populating the indicators. Many aggregative spawnersare data deficient and it is necessary to use life history tools to provide parameter estimates forthe indicators. While it is recognised that data derived from such tools are uncertain, the index isrelative and the absolute values decrease in importance as more species of divergent life histories1<strong>10</strong>
are added. Consequently, the life history indicators aligned the vulnerability of our 47 species withknown variation in levels of vulnerability to fishing among reef fish species and families (Jenningset al. 1999; Hicks and McClanahan 2012). More accurate estimates of growth parameters maybe obtained from published studies. However, this approach would not be without many of theproblems that have prompted the development of life history tools for data deficient species. Theseinclude, among others, defining selection criteria or averaging methods when multiple estimates ofparameters are available, and selecting empirical relationships or substitution procedures if certainparameter estimates were lacking.The indicators for sexual pattern and aggregation type could be improved. Sexual pattern informationon FishBase is outdated for many species and could be updated from recent reproductive studies (aswas done for Epinephelus polyphekadion in Rhodes et al. 2011). Aggregation type was also unknownin the SCRFA Global Database (20<strong>10</strong>) for many species. These species can be reintroduced tothe index as more information becomes available. Both these indicators were binomial in thispreliminary evaluation of the framework. However, in the case of aggregation type, it may bepossible to add additional levels of vulnerability, for example, based on the relative contributionof a single aggregation to the annual reproductive output of the population. There is evidence tosuggest that transient spawners spreading their annual reproductive output over numerous butrelatively small aggregations (e.g. Plectropomus leopardus; Samoilys 1997b; Sadovy and Domeier2005), can be less vulnerable to fishing compared to species forming a few very large aggregationsper population each year (e.g. E. striatus: Sadovy de Mitcheson et al. 2012; E. polyphekadion:Robinson et al. 2008b). Likewise, some siganids form numerous aggregations over protracted<strong>spawning</strong> seasons, thereby reducing the importance of any single aggregation to the annualreproductive output of the population (Robinson et al. 2011). However, there are many species inthe index for which aggregation dynamics (e.g. number, size and periodicity) are less well known,which would complicate the use of a finer-scale indicator for aggregation type.There is a need to identify further empirical datasets that can be used for testing the validity of theintrinsic index. While we found a strong correlation between the index and abundance trends forFiji reef fish, the modelled linear relationship was only statistically significant at the <strong>10</strong>% level. Alow level of significance resulted from the low number of verified aggregative spawners (7 species)with trends explainable by fishing, and the high variation in intrinsic vulnerability for speciesexhibiting a moderate decline in abundance (i.e. L. gibbus, E. polyphekadion, C. argus, P. laevis).The test using the IUCN data was also inhibited by the high number (19 out of 47 species) ofaggregative spawners lacking assessments, and most species with IUCN assessment were categorisedas Least Concern. These constraints precluded a repeat of the test conducted by Cheung et al.(2005), wherein only categories of Vulnerable and above were used.In constructing our intrinsic index, the indicators were not weighted, either in terms of theirrelative importance or their usefulness/ability in predicting vulnerability. Regarding the formerapproach, the empirical evidence for weighting among life history parameters is uncertain, a factthat may undermine weighting schemes based on expert opinion. For example, age at maturity isconsidered important (Musick 1999), but the relationships between several life history parametersare invariant and this parameter may be strongly correlated with the growth coefficient and withmaximum age (Musick 1999; Dulvy et al. 2004). The perceived importance of certain parametersalso varies between different schemes (e.g. fecundity: Musick 1999; Cheung et al. 2005). Moreover,weighting was inappropriate for sexual pattern and aggregation type as these were applied asmultipliers. In terms of the second approach, the usefulness of indicators in constructing an indexrelates to properties of the data, such as contrast across samples (i.e. species) that can be examinedusing statistical analyses. However, initial attempts to weight intrinsic indicators using principalcomponent analysis to derive factor scores for each parameter were invalidated since the life historyinvariants resulted in a strongly distorted ordination (‘horseshoe effect’).111
- Page 4:
The designation of geographical ent
- Page 9:
Chapter 1: IntroductionJan Robinson
- Page 12 and 13:
limited, subsistence levels of expl
- Page 14:
NTRs for spawning aggregations usin
- Page 17 and 18:
al. 2003). Verification may include
- Page 19 and 20:
a fraction of spawning sites are pr
- Page 21 and 22:
Chapter 3: Targeted fishing of the
- Page 23 and 24:
verifying spawning aggregations, we
- Page 25 and 26:
ecorded from inshore close to the c
- Page 27 and 28:
(a)(b)Fig. 3. Spatial patterns ofca
- Page 30 and 31:
pooled sizes of the three spawning
- Page 32 and 33:
found S. sutor contributed up to 44
- Page 34 and 35:
2011b). However, observations of fi
- Page 36 and 37:
MethodsTo identify seasonal and lun
- Page 38 and 39:
n=199Females GSI (mean ± SE)2.521.
- Page 40 and 41:
The estimate of size at maturity in
- Page 42 and 43:
This study was designed to verify S
- Page 44 and 45:
were selected. Fish selected for ta
- Page 46 and 47:
The number of traps increased on th
- Page 48 and 49:
Of the 9 tagged fish detected by re
- Page 50 and 51:
Fig. 7. Diel patterns ofdetection f
- Page 52 and 53:
Spawning aggregation site fidelity
- Page 54 and 55:
Chapter 6: Shoemaker spinefoot rabb
- Page 56 and 57:
anterior of the anus and below the
- Page 58 and 59:
A high percentage (80.8%) of depart
- Page 60 and 61:
arrivals and departures at these tw
- Page 62 and 63:
are typically applied for reef fish
- Page 64 and 65:
(a)(b)(c)Chapter 3, Figure 3. Spati
- Page 66 and 67:
(1)(2)(3)(4)(5)(6)Chapter 7, Table
- Page 68 and 69: Chapter 12, Fig. 1 Fraction of fema
- Page 70 and 71: Plates 8. Selected photographs from
- Page 72 and 73: MethodsStudy sitesThe study area wa
- Page 74 and 75: which shelved gently ( ca. 25 o ) t
- Page 76 and 77: Fig. 4. Lunar periodicity in number
- Page 78 and 79: Behaviour and appearanceDescription
- Page 80 and 81: eported aggregations forming betwee
- Page 82 and 83: The sizes of E. fuscoguttatus aggre
- Page 84 and 85: Materials and methodsStudy area and
- Page 86 and 87: TL. All fish tagged were considered
- Page 88 and 89: Lunar timing of arrivals and depart
- Page 90 and 91: Fig. 8. The presence and absence of
- Page 92 and 93: aggregation fishing. This critical
- Page 94 and 95: Chapter 9: Persistence of grouper (
- Page 96 and 97: ResultsBetween 2003 and 2006, the c
- Page 98 and 99: Fig. 2. Mean (± standard error, SE
- Page 100 and 101: A few species (e.g. Epinephelus gut
- Page 102 and 103: (a)(b)Fig. 1. Map of (a) study site
- Page 104 and 105: Fig. 2. Number of E. lanceolatus ob
- Page 106 and 107: was having any impact on the popula
- Page 108 and 109: A spawning aggregation is said to o
- Page 110 and 111: Chapter 11: Evaluation of an indica
- Page 112 and 113: Table 1 Aggregation fisheries asses
- Page 114 and 115: the lists of Jennings et al. (1999)
- Page 116 and 117: with the more vulnerable labrids an
- Page 120 and 121: Spawning aggregation behaviour is c
- Page 122 and 123: tiger grouper, Mycteroperca tigris:
- Page 124 and 125: of protecting the normal residence
- Page 126 and 127: • Since grouper males are afforde
- Page 128 and 129: Fig. 2 Yield-per-recruit normalized
- Page 130 and 131: The approaches identified above are
- Page 132 and 133: during full moon periods. Siganus s
- Page 134 and 135: model, many parameter estimates are
- Page 136 and 137: ReferencesAbunge C (2011) Managing
- Page 138 and 139: Cox DR (1972) Regression models and
- Page 140 and 141: Grüss A, Kaplan DM, Hart DR (2011b
- Page 142 and 143: Kaunda-Arara B, Rose GA (2004a) Eff
- Page 144: Newcomer RT, Taylor DH, Guttman SI
- Page 147 and 148: Sancho G, Petersen CW, Lobel PS (20
- Page 149 and 150: Appendix 1. QuestionnaireMASMA SPAW
- Page 151 and 152: 8. Spawning aggregation knowledgeUs
- Page 153 and 154: Example items KSh Furthest site Clo
- Page 155 and 156: Appendix II. Experimental testing o
- Page 157 and 158: Clove oil concentrationAt a concent
- Page 159 and 160: Appendix III. Application of acoust
- Page 161 and 162: 153