

WIOMSA-CORDIO spawning book Full Doc 10 oct 13.pdf
WIOMSA-CORDIO spawning book Full Doc 10 oct 13.pdf
WIOMSA-CORDIO spawning book Full Doc 10 oct 13.pdf

Create successful ePaper yourself
Turn your PDF publications into a flip-book with our unique Google optimized e-Paper software.
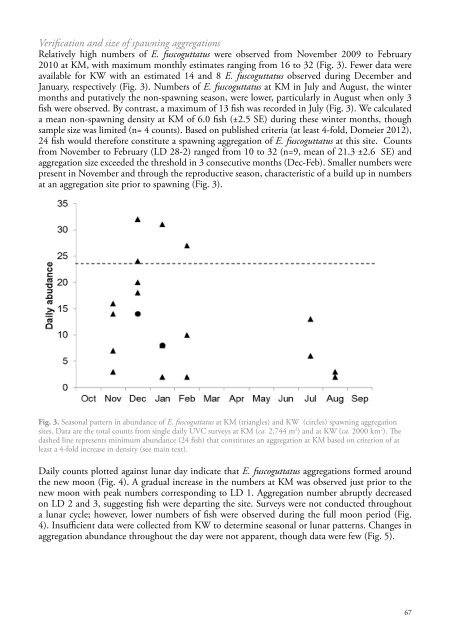
Verification and size of <strong>spawning</strong> aggregationsRelatively high numbers of E. fuscoguttatus were observed from November 2009 to February20<strong>10</strong> at KM, with maximum monthly estimates ranging from 16 to 32 (Fig. 3). Fewer data wereavailable for KW with an estimated 14 and 8 E. fuscoguttatus observed during December andJanuary, respectively (Fig. 3). Numbers of E. fuscoguttatus at KM in July and August, the wintermonths and putatively the non-<strong>spawning</strong> season, were lower, particularly in August when only 3fish were observed. By contrast, a maximum of 13 fish was recorded in July (Fig. 3). We calculateda mean non-<strong>spawning</strong> density at KM of 6.0 fish (±2.5 SE) during these winter months, thoughsample size was limited (n= 4 counts). Based on published criteria (at least 4-fold, Domeier 2012),24 fish would therefore constitute a <strong>spawning</strong> aggregation of E. fuscoguttatus at this site. Countsfrom November to February (LD 28-2) ranged from <strong>10</strong> to 32 (n=9, mean of 21.3 ±2.6 SE) andaggregation size exceeded the threshold in 3 consecutive months (Dec-Feb). Smaller numbers werepresent in November and through the reproductive season, characteristic of a build up in numbersat an aggregation site prior to <strong>spawning</strong> (Fig. 3).Fig. 3. Seasonal pattern in abundance of E. fuscoguttatus at KM (triangles) and KW (circles) <strong>spawning</strong> aggregationsites. Data are the total counts from single daily UVC surveys at KM (ca. 2,744 m 2 ) and at KW (ca. 2000 km 2 ). Thedashed line represents minimum abundance (24 fish) that constitutes an aggregation at KM based on criterion of atleast a 4-fold increase in density (see main text).Daily counts plotted against lunar day indicate that E. fuscoguttatus aggregations formed aroundthe new moon (Fig. 4). A gradual increase in the numbers at KM was observed just prior to thenew moon with peak numbers corresponding to LD 1. Aggregation number abruptly decreasedon LD 2 and 3, suggesting fish were departing the site. Surveys were not conducted throughouta lunar cycle; however, lower numbers of fish were observed during the full moon period (Fig.4). Insufficient data were collected from KW to determine seasonal or lunar patterns. Changes inaggregation abundance throughout the day were not apparent, though data were few (Fig. 5).67


