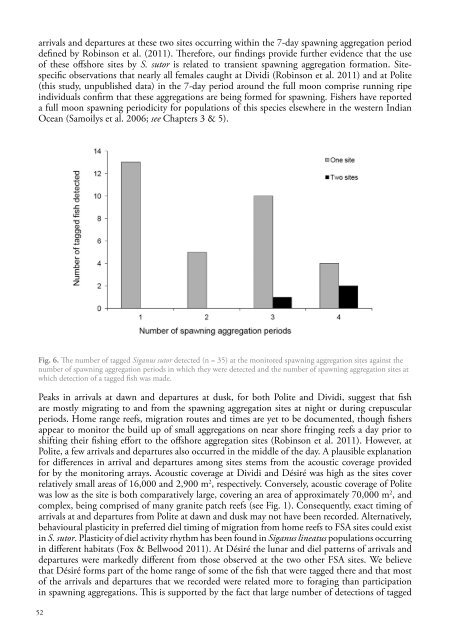
arrivals and departures at these two sites occurring within the 7-day <strong>spawning</strong> aggregation perioddefined by Robinson et al. (2011). Therefore, our findings provide further evidence that the useof these offshore sites by S. sutor is related to transient <strong>spawning</strong> aggregation formation. Sitespecificobservations that nearly all females caught at Dividi (Robinson et al. 2011) and at Polite(this study, unpublished data) in the 7-day period around the full moon comprise running ripeindividuals confirm that these aggregations are being formed for <strong>spawning</strong>. Fishers have reporteda full moon <strong>spawning</strong> periodicity for populations of this species elsewhere in the western IndianOcean (Samoilys et al. 2006; see Chapters 3 & 5).Fig. 6. The number of tagged Siganus sutor detected (n = 35) at the monitored <strong>spawning</strong> aggregation sites against thenumber of <strong>spawning</strong> aggregation periods in which they were detected and the number of <strong>spawning</strong> aggregation sites atwhich detection of a tagged fish was made.Peaks in arrivals at dawn and departures at dusk, for both Polite and Dividi, suggest that fishare mostly migrating to and from the <strong>spawning</strong> aggregation sites at night or during crepuscularperiods. Home range reefs, migration routes and times are yet to be documented, though fishersappear to monitor the build up of small aggregations on near shore fringing reefs a day prior toshifting their fishing effort to the offshore aggregation sites (Robinson et al. 2011). However, atPolite, a few arrivals and departures also occurred in the middle of the day. A plausible explanationfor differences in arrival and departures among sites stems from the acoustic coverage providedfor by the monitoring arrays. Acoustic coverage at Dividi and Désiré was high as the sites coverrelatively small areas of 16,000 and 2,900 m 2 , respectively. Conversely, acoustic coverage of Politewas low as the site is both comparatively large, covering an area of approximately 70,000 m 2 , andcomplex, being comprised of many granite patch reefs (see Fig. 1). Consequently, exact timing ofarrivals at and departures from Polite at dawn and dusk may not have been recorded. Alternatively,behavioural plasticity in preferred diel timing of migration from home reefs to FSA sites could existin S. sutor. Plasticity of diel activity rhythm has been found in Siganus lineatus populations occurringin different habitats (Fox & Bellwood 2011). At Désiré the lunar and diel patterns of arrivals anddepartures were markedly different from those observed at the two other FSA sites. We believethat Désiré forms part of the home range of some of the fish that were tagged there and that mostof the arrivals and departures that we recorded were related more to foraging than participationin <strong>spawning</strong> aggregations. This is supported by the fact that large number of detections of tagged52
fish at Désiré were made outside the 7-day full moon <strong>spawning</strong> aggregation period, as opposed toPolite and Dividi where detections were mostly concentrated in that period. Siganids appear toutilise large home ranges (Fox and Bellwood 2011) and the Désiré, Dividi and Polite populationsmay display differential habitat use for foraging, depending on local geomorphology and habitatdistribution. Crepuscular and night periods are generally associated with high rates of predation(Danilowicz and Sale 1999; Holbrook & Schmitt 2002, but see Sancho et al. 2000) and predationon <strong>spawning</strong> fish is known to be intense at some sites (Moyer 1987; Sancho et al. 2000). Therefore,the timing of arrivals and departures to crepuscular periods may be a strategy for reducing theencounter rate with predators at <strong>spawning</strong> aggregation sites.Siganus sutor exhibited high <strong>spawning</strong> site fidelity during the two monitoring periods, whichwhen combined constituted almost the entire <strong>spawning</strong> season for the population (Robinson etal. 2011). Nonetheless, since fidelity was not absolute, a degree of behavioural polymorphism(Attwood and Bennett 1994) appears to occur in the population. For polymorphic individuals,selecting <strong>spawning</strong> sites is unlikely to be a random process as relatively high levels of inter-monthlyfidelity to a single site (up to 3 consecutive months) were still observed after or prior to changingsites. Our interpretation of behavioural polymorphism could actually be a bet-hedging strategyagainst environmental variability (Lambert and Ware 1984) or a response to changes in matingopportunities (Draud and Itzkowitz 2004) at a particular FSA site.Residency times of acoustically tagged fish at the three monitored FSA sites varied in time withhigher mean residency time recorded in the first compared to the second monitoring period. Ashortening of residency time with the progression of the <strong>spawning</strong> season may relate to changes inreproductive output if the energy budget tends towards increased somatic growth as the protracted<strong>spawning</strong> season progresses. Many species spawn multiple batches of eggs within a single <strong>spawning</strong>period (Hunter and Macewicz, 1980; Pears et al. 2007), including the closely related Siganuscanaliculatus (Hoque et al. 1999), and co-occurrence of post-ovulatory follicles and hydratedoocytes has been observed in ovaries of S. sutor sampled from Praslin aggregations (SeychellesFishing Authority, unpublished data). Detailed reproductive biology studies of batch size and thefrequency of their release across the <strong>spawning</strong> season would offer insights on variation in residencytimes.While several hypotheses have been postulated as to why fish select certain sites to spawn (Molloyet al. 2012), little in the way of consensus on underlying mechanisms has emerged from theexisting empirical or theoretical evidence. In the case of the S. sutor population at Praslin, coastalgeomorphology and physical characteristics appear to be important in the selection of <strong>spawning</strong>sites. All <strong>spawning</strong> sites studied are located offshore at depths of between 15 and 20 m, with coralcover in excess of 60% and moderate current speed of between 0.1 – 0.3 m s -1 (Seychelles FishingAuthority, unpublished data). Since siganids have negatively buoyant, demersal and adhesive eggs(Thresher 1991), they presumably require a clean surface for egg attachment (e.g. Gafny et al.(1992)), conditions that may be met on the offshore granite patch reefs selected by Siganus sutor atPraslin, as opposed to inshore reefs that receive comparatively high levels of terrigenous sedimentand run-off (Littler et al. 1991). Compared to emergent fringing reefs, submerged offshore sitesmay also prevent eggs from being dislodged by wave action. Similarly, in Kenya, S. sutor are knownto spawn on deeper offshore patch reefs (see Chapters 3 and 5), while <strong>spawning</strong> at similar depthshas been documented in Siganus lineatus from Micronesia (Johannes 1981).This study provided information on the spatial and temporal <strong>spawning</strong> aggregation dynamics ofa regionally important species of rabbitfish, a family for which reproductive behaviour is poorlydocumented compared to families such as the Serranidae. In the WIO, S. sutor constitutes the mostimportant target species in many coastal reef fisheries (Everett et al. 20<strong>10</strong>; Hicks & McClanahan2012). Siganids are also key species for ecosystem resilience since they may be the dominantherbivores on coral reefs (Cheal et al. 20<strong>10</strong>). In addition to gear management, spatial measures53
- Page 4:
The designation of geographical ent
- Page 9: Chapter 1: IntroductionJan Robinson
- Page 12 and 13: limited, subsistence levels of expl
- Page 14: NTRs for spawning aggregations usin
- Page 17 and 18: al. 2003). Verification may include
- Page 19 and 20: a fraction of spawning sites are pr
- Page 21 and 22: Chapter 3: Targeted fishing of the
- Page 23 and 24: verifying spawning aggregations, we
- Page 25 and 26: ecorded from inshore close to the c
- Page 27 and 28: (a)(b)Fig. 3. Spatial patterns ofca
- Page 30 and 31: pooled sizes of the three spawning
- Page 32 and 33: found S. sutor contributed up to 44
- Page 34 and 35: 2011b). However, observations of fi
- Page 36 and 37: MethodsTo identify seasonal and lun
- Page 38 and 39: n=199Females GSI (mean ± SE)2.521.
- Page 40 and 41: The estimate of size at maturity in
- Page 42 and 43: This study was designed to verify S
- Page 44 and 45: were selected. Fish selected for ta
- Page 46 and 47: The number of traps increased on th
- Page 48 and 49: Of the 9 tagged fish detected by re
- Page 50 and 51: Fig. 7. Diel patterns ofdetection f
- Page 52 and 53: Spawning aggregation site fidelity
- Page 54 and 55: Chapter 6: Shoemaker spinefoot rabb
- Page 56 and 57: anterior of the anus and below the
- Page 58 and 59: A high percentage (80.8%) of depart
- Page 62 and 63: are typically applied for reef fish
- Page 64 and 65: (a)(b)(c)Chapter 3, Figure 3. Spati
- Page 66 and 67: (1)(2)(3)(4)(5)(6)Chapter 7, Table
- Page 68 and 69: Chapter 12, Fig. 1 Fraction of fema
- Page 70 and 71: Plates 8. Selected photographs from
- Page 72 and 73: MethodsStudy sitesThe study area wa
- Page 74 and 75: which shelved gently ( ca. 25 o ) t
- Page 76 and 77: Fig. 4. Lunar periodicity in number
- Page 78 and 79: Behaviour and appearanceDescription
- Page 80 and 81: eported aggregations forming betwee
- Page 82 and 83: The sizes of E. fuscoguttatus aggre
- Page 84 and 85: Materials and methodsStudy area and
- Page 86 and 87: TL. All fish tagged were considered
- Page 88 and 89: Lunar timing of arrivals and depart
- Page 90 and 91: Fig. 8. The presence and absence of
- Page 92 and 93: aggregation fishing. This critical
- Page 94 and 95: Chapter 9: Persistence of grouper (
- Page 96 and 97: ResultsBetween 2003 and 2006, the c
- Page 98 and 99: Fig. 2. Mean (± standard error, SE
- Page 100 and 101: A few species (e.g. Epinephelus gut
- Page 102 and 103: (a)(b)Fig. 1. Map of (a) study site
- Page 104 and 105: Fig. 2. Number of E. lanceolatus ob
- Page 106 and 107: was having any impact on the popula
- Page 108 and 109: A spawning aggregation is said to o
- Page 110 and 111:
Chapter 11: Evaluation of an indica
- Page 112 and 113:
Table 1 Aggregation fisheries asses
- Page 114 and 115:
the lists of Jennings et al. (1999)
- Page 116 and 117:
with the more vulnerable labrids an
- Page 118 and 119:
The remaining serranid populations
- Page 120 and 121:
Spawning aggregation behaviour is c
- Page 122 and 123:
tiger grouper, Mycteroperca tigris:
- Page 124 and 125:
of protecting the normal residence
- Page 126 and 127:
• Since grouper males are afforde
- Page 128 and 129:
Fig. 2 Yield-per-recruit normalized
- Page 130 and 131:
The approaches identified above are
- Page 132 and 133:
during full moon periods. Siganus s
- Page 134 and 135:
model, many parameter estimates are
- Page 136 and 137:
ReferencesAbunge C (2011) Managing
- Page 138 and 139:
Cox DR (1972) Regression models and
- Page 140 and 141:
Grüss A, Kaplan DM, Hart DR (2011b
- Page 142 and 143:
Kaunda-Arara B, Rose GA (2004a) Eff
- Page 144:
Newcomer RT, Taylor DH, Guttman SI
- Page 147 and 148:
Sancho G, Petersen CW, Lobel PS (20
- Page 149 and 150:
Appendix 1. QuestionnaireMASMA SPAW
- Page 151 and 152:
8. Spawning aggregation knowledgeUs
- Page 153 and 154:
Example items KSh Furthest site Clo
- Page 155 and 156:
Appendix II. Experimental testing o
- Page 157 and 158:
Clove oil concentrationAt a concent
- Page 159 and 160:
Appendix III. Application of acoust
- Page 161 and 162:
153