

President
ERP_Cover_Proofs with green barcode.indd - The American ...
ERP_Cover_Proofs with green barcode.indd - The American ...

Create successful ePaper yourself
Turn your PDF publications into a flip-book with our unique Google optimized e-Paper software.
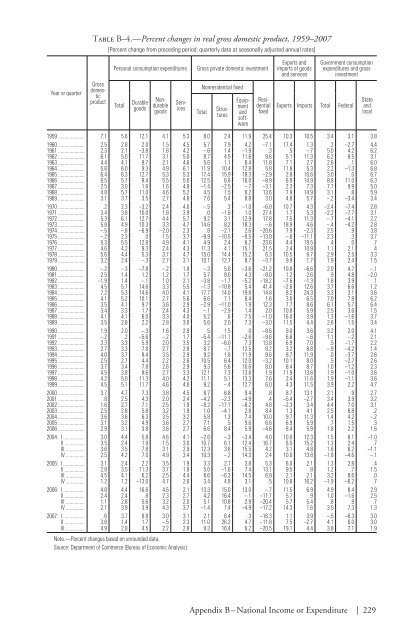
Table B–4.—Percent changes in real gross domestic product, 1959–2007[Percent change from preceding period; quarterly data at seasonally adjusted annual rates]Year or quarterGrossdomesticproductPersonal consumption expendituresTotalDurablegoodsNondurablegoodsGross private domestic investmentNonresidential fixedTotalStructuresEquipmentandsoftwareServicesResidentialfixedExports andimports of goodsand servicesGovernment consumptionexpenditures and grossinvestmentExports Imports Total FederalStateandlocal1959 7.1 5.6 12.1 4.1 5.3 8.0 2.4 11.9 25.4 10.3 10.5 3.4 3.1 3.81960 2.5 2.8 2.0 1.5 4.5 5.7 7.9 4.2 –7.1 17.4 1.3 .2 –2.7 4.41961 2.3 2.1 –3.8 1.8 4.2 –.6 1.4 –1.9 .3 .5 –.7 5.0 4.2 6.21962 6.1 5.0 11.7 3.1 5.0 8.7 4.5 11.6 9.6 5.1 11.3 6.2 8.5 3.11963 4.4 4.1 9.7 2.1 4.6 5.6 1.1 8.4 11.8 7.1 2.7 2.6 .1 6.01964 5.8 6.0 9.3 4.9 6.1 11.9 10.4 12.8 5.8 11.8 5.3 2.2 –1.3 6.81965 6.4 6.3 12.7 5.3 5.3 17.4 15.9 18.3 –2.9 2.8 10.6 3.0 .0 6.71966 6.5 5.7 8.4 5.5 5.0 12.5 6.8 16.0 –8.9 6.9 14.9 8.8 11.0 6.31967 2.5 3.0 1.6 1.6 4.9 –1.4 –2.5 –.7 –3.1 2.3 7.3 7.7 9.9 5.01968 4.8 5.7 11.0 4.6 5.2 4.5 1.5 6.2 13.6 7.9 14.9 3.1 .8 5.91969 3.1 3.7 3.5 2.7 4.8 7.6 5.4 8.8 3.0 4.8 5.7 –.2 –3.4 3.41970 .2 2.3 –3.2 2.4 4.0 –.5 .3 –1.0 –6.0 10.7 4.3 –2.4 –7.4 2.81971 3.4 3.8 10.0 1.8 3.9 .0 –1.6 1.0 27.4 1.7 5.3 –2.2 –7.7 3.11972 5.3 6.1 12.7 4.4 5.7 9.2 3.1 12.9 17.8 7.5 11.3 –.7 –4.1 2.21973 5.8 4.9 10.3 3.3 4.7 14.6 8.2 18.3 –.6 18.9 4.6 –.4 –4.2 2.81974 –.5 –.8 –6.9 –2.0 2.3 .8 –2.1 2.6 –20.6 7.9 –2.3 2.5 .9 3.81975 –.2 2.3 .0 1.5 3.7 –9.9 –10.5 –9.5 –13.0 –.6 –11.1 2.3 .3 3.71976 5.3 5.5 12.8 4.9 4.1 4.9 2.4 6.2 23.6 4.4 19.5 .4 .0 .71977 4.6 4.2 9.3 2.4 4.3 11.3 4.1 15.1 21.5 2.4 10.9 1.1 2.1 .41978 5.6 4.4 5.3 3.7 4.7 15.0 14.4 15.2 6.3 10.5 8.7 2.9 2.5 3.31979 3.2 2.4 –.3 2.7 3.1 10.1 12.7 8.7 –3.7 9.9 1.7 1.9 2.4 1.51980 –.2 –.3 –7.8 –.2 1.8 –.3 5.8 –3.6 –21.2 10.8 –6.6 2.0 4.7 –.11981 2.5 1.4 1.2 1.2 1.7 5.7 8.0 4.3 –8.0 1.2 2.6 .9 4.8 –2.01982 –1.9 1.4 –.1 1.0 2.1 –3.8 –1.7 –5.2 –18.2 –7.6 –1.3 1.8 3.9 .11983 4.5 5.7 14.6 3.3 5.5 –1.3 –10.8 5.4 41.4 –2.6 12.6 3.7 6.6 1.21984 7.2 5.3 14.6 4.0 4.1 17.7 14.0 19.8 14.8 8.2 24.3 3.3 3.1 3.61985 4.1 5.2 10.1 2.7 5.6 6.6 7.1 6.4 1.6 3.0 6.5 7.0 7.8 6.21986 3.5 4.1 9.7 3.6 2.9 –2.9 –11.0 1.9 12.3 7.7 8.6 6.1 5.7 6.41987 3.4 3.3 1.7 2.4 4.3 –.1 –2.9 1.4 2.0 10.8 5.9 2.5 3.6 1.51988 4.1 4.1 6.0 3.3 4.0 5.2 .6 7.5 –1.0 16.0 3.9 1.3 –1.6 3.71989 3.5 2.8 2.2 2.8 3.0 5.6 2.0 7.3 –3.0 11.5 4.4 2.6 1.5 3.41990 1.9 2.0 –.3 1.6 2.9 .5 1.5 .0 –8.6 9.0 3.6 3.2 2.0 4.11991 –.2 .2 –5.6 –.2 1.7 –5.4 –11.1 –2.6 –9.6 6.6 –.6 1.1 –.2 2.11992 3.3 3.3 5.9 2.0 3.5 3.2 –6.0 7.3 13.8 6.9 7.0 .5 –1.7 2.21993 2.7 3.3 7.8 2.7 2.8 8.7 –.7 12.5 8.2 3.2 8.8 –.9 –4.2 1.41994 4.0 3.7 8.4 3.5 2.9 9.2 1.8 11.9 9.6 8.7 11.9 .0 –3.7 2.61995 2.5 2.7 4.4 2.2 2.6 10.5 6.4 12.0 –3.2 10.1 8.0 .5 –2.7 2.61996 3.7 3.4 7.8 2.6 2.9 9.3 5.6 10.6 8.0 8.4 8.7 1.0 –1.2 2.31997 4.5 3.8 8.6 2.7 3.3 12.1 7.3 13.8 1.9 11.9 13.6 1.9 –1.0 3.61998 4.2 5.0 11.3 4.0 4.2 11.1 5.1 13.3 7.6 2.4 11.6 1.9 –1.1 3.61999 4.5 5.1 11.7 4.6 4.0 9.2 –.4 12.7 6.0 4.3 11.5 3.9 2.2 4.72000 3.7 4.7 7.3 3.8 4.5 8.7 6.8 9.4 .8 8.7 13.1 2.1 .9 2.72001 .8 2.5 4.3 2.0 2.4 –4.2 –2.3 –4.9 .4 –5.4 –2.7 3.4 3.9 3.22002 1.6 2.7 7.1 2.5 1.9 –9.2 –17.1 –6.2 4.8 –2.3 3.4 4.4 7.0 3.12003 2.5 2.8 5.8 3.2 1.9 1.0 –4.1 2.8 8.4 1.3 4.1 2.5 6.8 .22004 3.6 3.6 6.3 3.5 3.2 5.8 1.3 7.4 10.0 9.7 11.3 1.4 4.2 –.22005 3.1 3.2 4.9 3.6 2.7 7.1 .5 9.6 6.6 6.9 5.9 .7 1.5 .32006 2.9 3.1 3.8 3.6 2.7 6.6 8.4 5.9 –4.6 8.4 5.9 1.8 2.2 1.62004: I 3.0 4.4 5.8 4.6 4.1 –2.6 –.3 –3.4 4.0 10.0 12.3 1.5 6.1 –1.0II 3.5 2.4 1.9 1.5 3.0 10.7 6.1 12.4 16.7 6.5 15.2 1.3 2.4 .7III 3.6 3.5 7.8 3.1 2.9 12.3 3.6 15.5 4.2 3.1 4.8 1.6 6.2 –1.1IV 2.5 4.2 7.0 4.9 3.4 10.3 –.2 14.3 2.4 10.0 13.8 –1.8 –4.6 –.12005: I 3.1 2.4 2.2 3.5 1.9 3.3 2.1 3.8 5.3 6.0 2.1 1.3 2.8 .4II 2.8 3.5 11.3 3.7 1.8 5.0 –1.6 7.4 13.1 9.5 .8 1.2 .7 1.5III 4.5 4.1 6.2 2.5 4.4 8.6 –6.3 14.5 6.9 2.1 2.1 3.2 8.6 .0IV 1.2 1.2 –13.0 4.7 2.6 3.4 4.8 3.1 .5 10.6 16.2 –1.9 –6.2 .72006: I 4.8 4.4 16.6 4.5 2.1 13.3 15.0 13.0 –.7 11.5 6.9 4.9 8.4 2.9II 2.4 2.4 .8 2.3 2.7 4.2 16.4 –.1 –11.7 5.7 .9 1.0 –1.6 2.5III 1.1 2.8 5.6 3.2 2.0 5.1 10.8 2.9 –20.4 5.7 5.4 .8 .9 .7IV 2.1 3.9 3.9 4.3 3.7 –1.4 7.4 –4.9 –17.2 14.3 1.6 3.5 7.3 1.32007: I .6 3.7 8.8 3.0 3.1 2.1 6.4 .3 –16.3 1.1 3.9 –.5 –6.3 3.0II 3.8 1.4 1.7 –.5 2.3 11.0 26.2 4.7 –11.8 7.5 –2.7 4.1 6.0 3.0III 4.9 2.8 4.5 2.2 2.8 9.3 16.4 6.2 –20.5 19.1 4.4 3.8 7.1 1.9Note.—Percent changes based on unrounded data.Source: Department of Commerce (Bureau of Economic Analysis).Appendix B – National Income or Expenditure | 229


