

President
ERP_Cover_Proofs with green barcode.indd - The American ...
ERP_Cover_Proofs with green barcode.indd - The American ...

You also want an ePaper? Increase the reach of your titles
YUMPU automatically turns print PDFs into web optimized ePapers that Google loves.
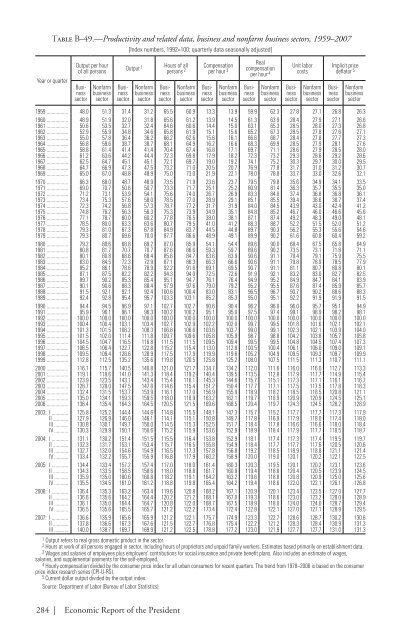
Table B–49.—Productivity and related data, business and nonfarm business sectors, 1959–2007Year or quarterOutput per hourof all personsBusinesssectorNonfarmbusinesssectorBusinesssector[Index numbers, 1992=100; quarterly data seasonally adjusted]Output 1NonfarmbusinesssectorHours of allpersons 2BusinesssectorNonfarmbusinesssectorCompensationper hour 3BusinesssectorNonfarmbusinesssectorRealcompensationper hour 4BusinesssectorNonfarmbusinesssectorBusinesssectorUnit laborcostsNonfarmbusinesssectorImplicit pricedeflator 5BusinesssectorNonfarmbusinesssector1959 48.0 51.3 31.4 31.2 65.5 60.9 13.3 13.9 59.9 62.3 27.8 27.1 26.8 26.31960 48.9 51.9 32.0 31.8 65.6 61.2 13.9 14.5 61.3 63.9 28.4 27.9 27.1 26.61961 50.6 53.5 32.7 32.4 64.6 60.6 14.4 15.0 63.1 65.3 28.5 28.0 27.3 26.81962 52.9 55.9 34.8 34.6 65.8 61.9 15.1 15.6 65.2 67.3 28.5 27.8 27.6 27.11963 55.0 57.8 36.4 36.2 66.2 62.6 15.6 16.1 66.6 68.7 28.4 27.8 27.7 27.31964 56.8 59.6 38.7 38.7 68.1 64.9 16.2 16.6 68.3 69.9 28.5 27.9 28.1 27.61965 58.8 61.4 41.4 41.4 70.4 67.4 16.8 17.1 69.7 71.1 28.6 27.9 28.5 28.01966 61.2 63.6 44.2 44.4 72.3 69.8 17.9 18.2 72.3 73.2 29.3 28.6 29.2 28.61967 62.5 64.7 45.1 45.1 72.1 69.7 19.0 19.2 74.1 75.2 30.3 29.7 30.0 29.51968 64.7 66.9 47.3 47.5 73.2 71.0 20.5 20.7 76.9 77.8 31.7 31.0 31.2 30.71969 65.0 67.0 48.8 48.9 75.0 73.0 21.9 22.1 78.0 78.8 33.7 33.0 32.6 32.11970 66.3 68.0 48.7 48.9 73.5 71.9 23.6 23.7 79.5 79.8 35.6 34.9 34.1 33.51971 69.0 70.7 50.6 50.7 73.3 71.7 25.1 25.2 80.9 81.4 36.3 35.7 35.5 35.01972 71.2 73.1 53.9 54.1 75.6 74.0 26.7 26.9 83.3 84.0 37.4 36.8 36.8 36.11973 73.4 75.3 57.6 58.0 78.5 77.0 28.9 29.1 85.1 85.5 39.4 38.6 38.7 37.41974 72.3 74.2 56.8 57.3 78.7 77.2 31.7 31.9 84.0 84.5 43.9 43.0 42.4 41.21975 74.8 76.2 56.3 56.3 75.3 73.9 34.9 35.1 84.8 85.2 46.7 46.0 46.6 45.61976 77.1 78.7 60.0 60.2 77.8 76.5 38.0 38.1 87.1 87.4 49.2 48.3 49.0 48.11977 78.5 80.0 63.3 63.6 80.7 79.5 41.0 41.2 88.3 88.7 52.2 51.5 52.0 51.21978 79.3 81.0 67.3 67.8 84.9 83.7 44.5 44.8 89.7 90.3 56.2 55.3 55.6 54.61979 79.3 80.7 69.6 70.0 87.7 86.6 48.9 49.1 89.9 90.2 61.6 60.8 60.4 59.21980 79.2 80.6 68.8 69.2 87.0 85.9 54.1 54.4 89.6 90.0 68.4 67.5 65.8 64.91981 80.8 81.7 70.7 70.7 87.6 86.6 59.3 59.7 89.6 90.2 73.5 73.1 71.8 71.11982 80.1 80.8 68.6 68.4 85.6 84.7 63.6 63.9 90.6 91.1 79.4 79.1 75.9 75.51983 83.0 84.5 72.3 72.9 87.1 86.3 66.3 66.6 90.6 91.1 79.8 78.9 78.5 77.91984 85.2 86.1 78.6 78.9 92.2 91.6 69.1 69.5 90.7 91.1 81.1 80.7 80.8 80.11985 87.1 87.5 82.2 82.2 94.3 94.0 72.5 72.6 91.9 92.1 83.2 83.0 82.7 82.51986 89.7 90.2 85.3 85.4 95.1 94.7 76.1 76.4 94.9 95.2 84.9 84.7 84.1 83.91987 90.1 90.6 88.3 88.4 97.9 97.6 79.0 79.2 95.2 95.5 87.6 87.4 85.9 85.71988 91.5 92.1 92.1 92.4 100.6 100.4 83.0 83.1 96.5 96.7 90.7 90.2 88.6 88.31989 92.4 92.8 95.4 95.7 103.3 103.1 85.2 85.3 95.0 95.1 92.2 91.9 91.9 91.51990 94.4 94.5 96.9 97.1 102.7 102.7 90.6 90.4 96.2 96.0 96.0 95.7 95.1 94.91991 95.9 96.1 96.1 96.3 100.2 100.2 95.1 95.0 97.5 97.4 99.1 98.9 98.2 98.11992 100.0 100.0 100.0 100.0 100.0 100.0 100.0 100.0 100.0 100.0 100.0 100.0 100.0 100.01993 100.4 100.4 103.1 103.4 102.7 102.9 102.2 102.0 99.7 99.5 101.8 101.6 102.1 102.11994 101.3 101.5 108.2 108.3 106.8 106.6 103.6 103.7 99.0 99.1 102.3 102.1 103.9 104.01995 101.5 102.0 111.4 111.8 109.7 109.6 105.8 105.9 98.7 98.8 104.2 103.8 105.7 105.81996 104.5 104.7 116.5 116.8 111.5 111.5 109.5 109.4 99.5 99.5 104.8 104.5 107.4 107.31997 106.5 106.4 122.7 122.8 115.2 115.4 113.0 112.8 100.5 100.4 106.1 106.0 109.0 109.11998 109.5 109.4 128.6 128.9 117.5 117.9 119.9 119.6 105.2 104.9 109.5 109.3 109.7 109.91999 112.8 112.5 135.2 135.6 119.8 120.5 125.8 125.2 108.0 107.5 111.5 111.3 110.7 111.12000 116.1 115.7 140.5 140.8 121.0 121.7 134.7 134.2 112.0 111.6 116.0 116.0 112.7 113.32001 119.1 118.6 141.0 141.3 118.4 119.2 140.4 139.5 113.5 112.8 117.9 117.7 114.9 115.42002 123.9 123.5 143.1 143.4 115.4 116.1 145.3 144.6 115.7 115.1 117.3 117.1 116.1 116.72003 128.7 128.0 147.5 147.8 114.6 115.4 151.2 150.4 117.7 117.1 117.5 117.5 117.8 118.32004 132.4 131.5 153.7 153.9 116.1 117.0 156.9 155.9 118.9 118.2 118.5 118.5 120.8 121.12005 135.0 134.1 159.3 159.5 118.0 118.9 163.2 162.1 119.7 118.9 120.9 120.9 124.5 125.12006 136.4 135.4 164.3 164.5 120.5 121.5 169.6 168.5 120.4 119.7 124.3 124.5 128.2 128.92003: I 125.8 125.2 144.4 144.6 114.8 115.5 148.1 147.3 115.7 115.2 117.7 117.7 117.3 117.9II 127.9 126.9 146.0 146.1 114.1 115.1 150.8 149.7 117.8 116.9 117.9 118.0 117.4 118.0III 130.8 130.1 149.7 150.0 114.5 115.3 152.5 151.7 118.4 117.8 116.6 116.6 118.0 118.4IV 130.3 129.9 150.1 150.6 115.2 115.9 153.6 152.9 118.9 118.4 117.9 117.7 118.5 118.72004: I 131.1 130.2 151.4 151.5 115.5 116.4 153.8 152.9 118.1 117.4 117.3 117.4 119.5 119.7II 132.3 131.7 153.1 153.4 115.7 116.5 155.8 154.9 118.4 117.7 117.7 117.6 120.5 120.6III 132.7 132.0 154.6 154.9 116.5 117.3 157.8 156.8 119.2 118.5 118.9 118.8 121.1 121.4IV 133.4 132.2 155.7 155.9 116.8 117.9 160.2 158.9 120.0 119.0 120.1 120.2 122.1 122.52005: I 134.4 133.4 157.2 157.4 117.0 118.0 161.4 160.3 120.3 119.5 120.1 120.2 123.1 123.6II 134.3 133.5 158.5 158.6 118.0 118.8 161.7 160.9 119.4 118.8 120.4 120.5 123.9 124.5III 135.9 135.0 160.6 160.8 118.2 119.1 164.2 163.2 119.6 118.8 120.8 120.9 125.0 125.6IV 135.5 134.5 161.0 161.2 118.8 119.8 165.4 164.2 119.4 118.6 122.0 122.1 126.1 126.82006: I 136.4 135.3 163.2 163.4 119.6 120.8 168.2 167.1 120.9 120.1 123.4 123.5 127.0 127.7II 136.6 135.6 164.2 164.4 120.2 121.2 168.1 167.0 119.3 118.6 123.0 123.2 128.0 128.9III 136.1 135.0 164.4 164.7 120.8 122.0 168.7 167.5 118.9 118.0 124.0 124.0 128.7 129.4IV 136.5 135.6 165.5 165.7 121.2 122.2 173.4 172.4 122.8 122.1 127.0 127.1 128.9 129.52007: I 136.6 135.9 165.6 165.9 121.2 122.1 175.7 174.9 123.3 122.7 128.6 128.7 130.2 130.6II 137.8 136.6 167.3 167.6 121.5 122.7 176.8 175.4 122.2 121.2 128.3 128.4 130.9 131.3III 140.0 138.7 169.7 169.9 121.2 122.5 178.8 177.2 123.0 121.9 127.7 127.7 131.0 131.31 Output refers to real gross domestic product in the sector.2 Hours at work of all persons engaged in sector, including hours of proprietors and unpaid family workers. Estimates based primarily on establishment data.3 Wages and salaries of employees plus employers’ contributions for social insurance and private benefit plans. Also includes an estimate of wages,salaries, and supplemental payments for the self-employed.4 Hourly compensation divided by the consumer price index for all urban consumers for recent quarters. The trend from 1978–2006 is based on the consumerprice index research series (CPI-U-RS).5 Current dollar output divided by the output index.Source: Department of Labor (Bureau of Labor Statistics).284 | Economic Report of the <strong>President</strong>


