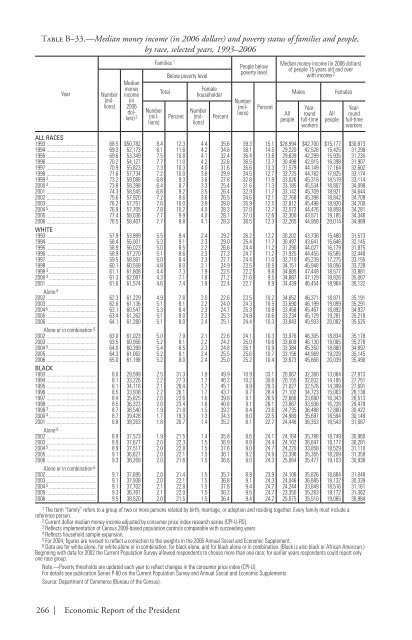
Table B–33.—Median money income (in 2006 dollars) and poverty status of families and people,by race, selected years, 1993–2006YearNumber(millions)Medianmoneyincome(in2006dollars)2Number(millions)Families 1TotalBelow poverty levelPercentFemalehouseholderPercentPeople belowpoverty levelNumber(millions)PercentMedian money income (in 2006 dollars)of people 15 years old and overwith income 2AllpeopleMalesNumber(millions)Yearroundfull-timeworkersAllpeopleFemalesYearroundfull-timeworkersALL RACES1993 68.5 $50,782 8.4 12.3 4.4 35.6 39.3 15.1 $28,994 $42,700 $15,177 $30,8731994 69.3 52,173 8.1 11.6 4.2 34.6 38.1 14.5 29,220 42,528 15,425 31,2981995 69.6 53,349 7.5 10.8 4.1 32.4 36.4 13.8 29,639 42,299 15,935 31,2351996 70.2 54,127 7.7 11.0 4.2 32.6 36.5 13.7 30,498 42,915 16,398 31,9071997 70.9 55,823 7.3 10.3 4.0 31.6 35.6 13.3 31,579 44,149 17,164 32,6021998 71.6 57,734 7.2 10.0 3.8 29.9 34.5 12.7 32,725 44,782 17,825 33,1741999 3 73.2 59,088 6.8 9.3 3.6 27.8 32.8 11.9 33,026 45,316 18,519 33,1142000 4 73.8 59,398 6.4 8.7 3.3 25.4 31.6 11.3 33,185 45,534 18,807 34,0982001 74.3 58,545 6.8 9.2 3.5 26.4 32.9 11.7 33,142 45,709 18,921 34,6442002 75.6 57,920 7.2 9.6 3.6 26.5 34.6 12.1 32,768 45,398 18,842 34,7092003 76.2 57,751 7.6 10.0 3.9 28.0 35.9 12.5 32,812 45,498 18,920 34,7002004 5 76.9 57,705 7.8 10.2 4.0 28.3 37.0 12.7 32,573 44,476 18,858 34,2812005 77.4 58,036 7.7 9.9 4.0 28.7 37.0 12.6 32,300 43,571 19,185 34,3462006 78.5 58,407 7.7 9.8 4.1 28.3 36.5 12.3 32,265 44,958 20,014 34,989WHITE1993 57.9 53,999 5.5 9.4 2.4 29.2 26.2 12.2 30,202 43,738 15,480 31,5731994 58.4 55,001 5.3 9.1 2.3 29.0 25.4 11.7 30,497 43,641 15,646 32,1451995 58.9 56,023 5.0 8.5 2.2 26.6 24.4 11.2 31,390 44,027 16,179 31,8751996 58.9 57,270 5.1 8.6 2.3 27.3 24.7 11.2 31,925 44,455 16,585 32,4481997 59.5 58,561 5.0 8.4 2.3 27.7 24.4 11.0 32,710 45,239 17,275 33,1551998 60.1 60,558 4.8 8.0 2.1 24.9 23.5 10.5 34,151 45,948 18,056 33,7281999 3 61.1 61,808 4.4 7.3 1.9 22.5 22.2 9.8 34,685 47,449 18,577 33,8812000 4 61.3 62,087 4.3 7.1 1.8 21.2 21.6 9.5 34,887 47,129 18,826 35,0672001 61.6 61,574 4.6 7.4 1.9 22.4 22.7 9.9 34,439 46,454 18,964 35,132Alone 62002 62.3 61,229 4.9 7.8 2.0 22.6 23.5 10.2 34,052 46,371 18,871 35,1912003 62.6 61,136 5.1 8.1 2.2 24.0 24.3 10.5 33,690 46,199 19,099 35,2912004 5 63.1 60,547 5.3 8.4 2.3 24.7 25.3 10.8 33,458 45,467 18,892 34,9372005 63.4 61,262 5.1 8.0 2.3 25.3 24.9 10.6 33,234 45,129 19,281 35,2182006 64.1 61,280 5.1 8.0 2.4 25.1 24.4 10.3 33,843 45,933 20,082 35,525Alone or in combination 62002 63.0 61,023 5.0 7.9 2.1 22.6 24.1 10.3 33,976 46,305 18,834 35,1782003 63.5 60,956 5.2 8.1 2.2 24.2 25.0 10.6 33,609 46,130 19,065 35,2782004 5 64.0 60,399 5.4 8.5 2.3 24.8 26.1 10.9 33,384 45,350 18,860 34,8972005 64.3 61,062 5.2 8.1 2.4 25.5 25.6 10.7 33,156 44,969 19,229 35,1452006 65.0 61,198 5.2 8.0 2.4 25.0 25.2 10.4 33,673 45,868 20,039 35,490BLACK1993 8.0 29,599 2.5 31.3 1.9 49.9 10.9 33.1 20,067 32,380 13,064 27,9131994 8.1 33,226 2.2 27.3 1.7 46.2 10.2 30.6 20,155 32,832 14,185 27,7511995 8.1 34,116 2.1 26.4 1.7 45.1 9.9 29.3 21,027 32,576 14,399 27,6911996 8.5 33,938 2.2 26.1 1.7 43.7 9.7 28.4 21,102 34,723 15,063 28,1381997 8.4 35,825 2.0 23.6 1.6 39.8 9.1 26.5 22,666 33,690 16,343 28,5131998 8.5 36,323 2.0 23.4 1.6 40.8 9.1 26.1 23,867 33,936 16,228 29,4791999 3 8.7 38,540 1.9 21.8 1.5 39.2 8.4 23.6 24,735 36,488 17,880 30,4222000 4 8.7 39,428 1.7 19.3 1.3 34.3 8.0 22.5 24,989 35,697 18,594 30,1492001 8.8 38,263 1.8 20.7 1.4 35.2 8.1 22.7 24,446 36,353 18,543 31,087Alone 62002 8.9 37,573 1.9 21.5 1.4 35.8 8.6 24.1 24,164 35,788 18,749 30,9602003 8.9 37,677 2.0 22.3 1.5 36.9 8.8 24.4 24,102 36,647 18,177 30,2812004 5 8.9 37,517 2.0 22.8 1.5 37.6 9.0 24.7 24,220 33,858 18,529 31,1102005 9.1 36,627 2.0 22.1 1.5 36.1 9.2 24.9 23,396 35,355 18,209 31,3592006 9.3 38,269 2.0 21.6 1.5 36.6 9.0 24.3 25,064 35,477 19,103 30,936Alone or in combination 62002 9.1 37,695 2.0 21.4 1.5 35.7 8.9 23.9 24,106 35,826 18,684 31,0482003 9.1 37,938 2.0 22.1 1.5 36.8 9.1 24.3 24,046 36,685 18,132 30,3392004 5 9.1 37,702 2.1 22.8 1.5 37.6 9.4 24.7 24,244 33,849 18,516 31,1612005 9.3 36,761 2.1 22.0 1.5 36.2 9.5 24.7 23,350 35,263 18,172 31,3622006 9.5 38,520 2.0 21.5 1.5 36.4 9.4 24.2 25,075 35,510 19,065 30,9841 The term “family” refers to a group of two or more persons related by birth, marriage, or adoption and residing together. Every family must include areference person.2 Current dollar median money income adjusted by consumer price index research series (CPI-U-RS).3 Reflects implementation of Census 2000-based population controls comparable with succeeding years.4 Reflects household sample expansion.5 For 2004, figures are revised to reflect a correction to the weights in the 2005 Annual Social and Economic Supplement.6 Data are for white alone, for white alone or in combination, for black alone, and for black alone or in combination. (Black is also black or African American.)Beginning with data for 2002 the Current Population Survey allowed respondents to choose more than one race; for earlier years respondents could report onlyone race group.Note.—Poverty thresholds are updated each year to reflect changes in the consumer price index (CPI-U).For details see publication Series P-60 on the Current Population Survey and Annual Social and Economic Supplements.Source: Department of Commerce (Bureau of the Census).266 | Economic Report of the <strong>President</strong>
Population, Employment, Wages, and ProductivityTable B–34.—Population by age group, 1929–2007[Thousands of persons]July 1TotalAge (years)Under 5 5-15 16-19 20-24 25-44 45-64 65 and over1929 121,767 11,734 26,800 9,127 10,694 35,862 21,076 6,4741933 125,579 10,612 26,897 9,302 11,152 37,319 22,933 7,3631939 130,880 10,418 25,179 9,822 11,519 39,354 25,823 8,7641940 132,122 10,579 24,811 9,895 11,690 39,868 26,249 9,0311941 133,402 10,850 24,516 9,840 11,807 40,383 26,718 9,2881942 134,860 11,301 24,231 9,730 11,955 40,861 27,196 9,5841943 136,739 12,016 24,093 9,607 12,064 41,420 27,671 9,8671944 138,397 12,524 23,949 9,561 12,062 42,016 28,138 10,1471945 139,928 12,979 23,907 9,361 12,036 42,521 28,630 10,4941946 141,389 13,244 24,103 9,119 12,004 43,027 29,064 10,8281947 144,126 14,406 24,468 9,097 11,814 43,657 29,498 11,1851948 146,631 14,919 25,209 8,952 11,794 44,288 29,931 11,5381949 149,188 15,607 25,852 8,788 11,700 44,916 30,405 11,9211950 152,271 16,410 26,721 8,542 11,680 45,672 30,849 12,3971951 154,878 17,333 27,279 8,446 11,552 46,103 31,362 12,8031952 157,553 17,312 28,894 8,414 11,350 46,495 31,884 13,2031953 160,184 17,638 30,227 8,460 11,062 46,786 32,394 13,6171954 163,026 18,057 31,480 8,637 10,832 47,001 32,942 14,0761955 165,931 18,566 32,682 8,744 10,714 47,194 33,506 14,5251956 168,903 19,003 33,994 8,916 10,616 47,379 34,057 14,9381957 171,984 19,494 35,272 9,195 10,603 47,440 34,591 15,3881958 174,882 19,887 36,445 9,543 10,756 47,337 35,109 15,8061959 177,830 20,175 37,368 10,215 10,969 47,192 35,663 16,2481960 180,671 20,341 38,494 10,683 11,134 47,140 36,203 16,6751961 183,691 20,522 39,765 11,025 11,483 47,084 36,722 17,0891962 186,538 20,469 41,205 11,180 11,959 47,013 37,255 17,4571963 189,242 20,342 41,626 12,007 12,714 46,994 37,782 17,7781964 191,889 20,165 42,297 12,736 13,269 46,958 38,338 18,1271965 194,303 19,824 42,938 13,516 13,746 46,912 38,916 18,4511966 196,560 19,208 43,702 14,311 14,050 47,001 39,534 18,7551967 198,712 18,563 44,244 14,200 15,248 47,194 40,193 19,0711968 200,706 17,913 44,622 14,452 15,786 47,721 40,846 19,3651969 202,677 17,376 44,840 14,800 16,480 48,064 41,437 19,6801970 205,052 17,166 44,816 15,289 17,202 48,473 41,999 20,1071971 207,661 17,244 44,591 15,688 18,159 48,936 42,482 20,5611972 209,896 17,101 44,203 16,039 18,153 50,482 42,898 21,0201973 211,909 16,851 43,582 16,446 18,521 51,749 43,235 21,5251974 213,854 16,487 42,989 16,769 18,975 53,051 43,522 22,0611975 215,973 16,121 42,508 17,017 19,527 54,302 43,801 22,6961976 218,035 15,617 42,099 17,194 19,986 55,852 44,008 23,2781977 220,239 15,564 41,298 17,276 20,499 57,561 44,150 23,8921978 222,585 15,735 40,428 17,288 20,946 59,400 44,286 24,5021979 225,055 16,063 39,552 17,242 21,297 61,379 44,390 25,1341980 227,726 16,451 38,838 17,167 21,590 63,470 44,504 25,7071981 229,966 16,893 38,144 16,812 21,869 65,528 44,500 26,2211982 232,188 17,228 37,784 16,332 21,902 67,692 44,462 26,7871983 234,307 17,547 37,526 15,823 21,844 69,733 44,474 27,3611984 236,348 17,695 37,461 15,295 21,737 71,735 44,547 27,8781985 238,466 17,842 37,450 15,005 21,478 73,673 44,602 28,4161986 240,651 17,963 37,404 15,024 20,942 75,651 44,660 29,0081987 242,804 18,052 37,333 15,215 20,385 77,338 44,854 29,6261988 245,021 18,195 37,593 15,198 19,846 78,595 45,471 30,1241989 247,342 18,508 37,972 14,913 19,442 79,943 45,882 30,6821990 250,132 18,856 38,632 14,466 19,323 81,291 46,316 31,2471991 253,493 19,208 39,349 13,992 19,414 82,844 46,874 31,8121992 256,894 19,528 40,161 13,781 19,314 83,201 48,553 32,3561993 260,255 19,729 40,904 13,953 19,101 83,766 49,899 32,9021994 263,436 19,777 41,689 14,228 18,758 84,334 51,318 33,3311995 266,557 19,627 42,510 14,522 18,391 84,933 52,806 33,7691996 269,667 19,408 43,172 15,057 17,965 85,527 54,396 34,1431997 272,912 19,233 43,833 15,433 17,992 85,737 56,283 34,4021998 276,115 19,145 44,332 15,856 18,250 85,663 58,249 34,6191999 279,295 19,136 44,755 16,164 18,672 85,408 60,362 34,7982000 1 282,430 19,188 45,159 16,217 19,195 85,171 62,421 35,0782001 1 285,454 19,354 45,202 16,269 19,896 84,973 64,426 35,3332002 1 288,427 19,544 45,177 16,335 20,451 84,744 66,582 35,5942003 1 291,289 19,783 45,117 16,393 20,887 84,486 68,667 35,9582004 1 294,056 20,070 44,978 16,547 21,107 84,331 70,712 36,3092005 1 296,940 20,315 44,827 16,690 21,202 84,256 72,862 36,7872006 1 299,801 20,418 44,665 17,010 21,252 84,312 74,884 37,2602007 302,045 1 Revised total population data are available as follows: 2000, 282,407; 2001, 285,339; 2002, 288,189; 2003, 290,941; 2004, 293,609; 2005, 296,329; and2006, 299,157.Note.—Includes Armed Forces overseas beginning with 1940. Includes Alaska and Hawaii beginning with 1950.All estimates are consistent with decennial census enumerations.Source: Department of Commerce (Bureau of the Census).Appendix B – Population, Employment, Wages, and Productivity | 267
- Page 1 and 2:
EconomicReportof thePresidentTransm
- Page 4 and 5:
C O N T E N T SPageECONOMIC REPORT
- Page 7 and 8:
ECONOMIC REPORT OF THE PRESIDENTTo
- Page 9:
$2 billion to a new international c
- Page 13:
LETTER OF TRANSMITTALCouncil of Eco
- Page 16 and 17:
chapter 3. the causes and consequen
- Page 18 and 19:
appendixesA. Report to the Presiden
- Page 20 and 21:
2-5. Mortgage Lending Today........
- Page 22 and 23:
Chapter 1: The Year in Reviewand th
- Page 24 and 25:
Chapter 3: The Causes and Consequen
- Page 26 and 27:
• Tax reductions in 2001 and 2003
- Page 28 and 29:
• More effective statistical use
- Page 30 and 31:
• Real GDP posted solid 2.5 perce
- Page 32 and 33:
elative to non-energy prices, while
- Page 34 and 35:
nonconforming mortgages in 2007. In
- Page 36 and 37:
In addition to incomes and mortgage
- Page 38 and 39:
Business InventoriesInventory inves
- Page 40 and 41:
Indeed, the growth in foreign econo
- Page 42 and 43:
During the 12 months of 2007, the u
- Page 44 and 45:
output measures announced in the an
- Page 46 and 47:
and government purchases. In contra
- Page 48 and 49:
Table 1-1.—Administration Economi
- Page 50 and 51:
Box 1-3 — continuedParticipation
- Page 52 and 53:
finalized), below its 1963-2006 ave
- Page 55 and 56:
C H A P T E R 2Credit and Housing M
- Page 57 and 58:
lends a debtor money today, which t
- Page 59 and 60:
Box 2-1 — continuedPrime loan: Lo
- Page 61 and 62:
Box 2-2 — continuedNRSROs. Critic
- Page 63 and 64:
Box 2-3 — continuedMortgage defau
- Page 65 and 66:
Box 2-3 — continuedmortgage defau
- Page 67 and 68:
Corporate bond yields also rose rel
- Page 69 and 70:
conduits in that SIVs have less acc
- Page 71 and 72:
International ImplicationsA notable
- Page 73 and 74:
come together to create a coordinat
- Page 75 and 76:
home is forgiven, that portion is t
- Page 77 and 78:
alternatives offered in the convent
- Page 79 and 80:
to such a change in wealth, which a
- Page 81:
lending. FHA Modernization will enc
- Page 84 and 85:
Economists often call attention to
- Page 86 and 87:
Box 3-1: Trade in ServicesDiscussio
- Page 88 and 89:
Box 3-2: The Current Account Defici
- Page 90 and 91:
Growth in Domestic ProductionA seco
- Page 92 and 93:
Exports and Foreign Direct Investme
- Page 94 and 95:
in CFIUS’s role in protecting nat
- Page 96 and 97:
these goods than if they were produ
- Page 98 and 99:
y import competition are electrical
- Page 101 and 102:
C H A P T E R 4The Importance of He
- Page 103 and 104:
Box 4-1: Health Effects on Job Prod
- Page 105 and 106:
health care spending growth. Rising
- Page 107 and 108:
While the study focused on spending
- Page 109 and 110:
Box 4-2 — continuedand without pr
- Page 111 and 112:
effective price of zero. Even if a
- Page 113 and 114:
deduction for health insurance to a
- Page 115 and 116:
To reduce the extent to which high-
- Page 117 and 118:
Administration supports broad adopt
- Page 119 and 120:
C H A P T E R 5Tax PolicySocieties
- Page 121 and 122:
in 2000. Tax revenues increased str
- Page 123 and 124:
Alternative Minimum TaxPrior to 196
- Page 125 and 126:
The Impact of Recent Tax Reductions
- Page 127 and 128:
35 percent marginal tax rate on the
- Page 129 and 130:
C corporations fall under the corpo
- Page 131 and 132:
Significance of Tax Cuts to Individ
- Page 133 and 134:
Box 5-1: Marriage Penalty BasicsIt
- Page 135 and 136:
The Structure of Business TaxesDesp
- Page 137 and 138:
investments are made. A more modest
- Page 139 and 140:
able to defer $35 of tax liability
- Page 141 and 142:
C H A P T E R 6The Nation’s Infra
- Page 143 and 144:
A monopolistic bridge owner may cho
- Page 145 and 146:
etween places to accommodating grow
- Page 147 and 148:
the same time. At hours when many d
- Page 149 and 150:
BridgesOn August 1, 2007, the I-35W
- Page 151 and 152:
where shippers have an alternative
- Page 153 and 154:
Freight shipments into and out of t
- Page 155 and 156:
Box 6-2: Delays at New York City Ai
- Page 157 and 158:
uilt, the marginal cost of transmis
- Page 159 and 160:
access was in mobile wireless conne
- Page 161 and 162:
Infrastructure PolicyThough the U.S
- Page 163 and 164:
could shorten the wait by adding an
- Page 165 and 166:
In 2005, the Federal Aviation Admin
- Page 167 and 168:
C H A P T E R 7Searching for Altern
- Page 169 and 170:
The first U.S. oil well was drilled
- Page 171 and 172:
Most of the oil consumed in the Uni
- Page 173 and 174:
Also, depending on the fuel and tec
- Page 175 and 176:
Table 7-1. —Estimated Average Lev
- Page 177 and 178:
Nevada. The facility is expected to
- Page 179 and 180:
Wind PowerWind power supplies about
- Page 181 and 182:
amounts of electricity, it could be
- Page 183 and 184:
years, as corn-based ethanol produc
- Page 185 and 186:
the power, range, and convenient fu
- Page 187 and 188:
other petroleum products is project
- Page 189 and 190:
To help meet the growing demand for
- Page 191 and 192:
C H A P T E R 8Improving Economic S
- Page 193 and 194:
The second largest Federal statisti
- Page 195 and 196:
As shown in Chart 8-3, spending on
- Page 197 and 198:
Monetary and fiscal policymakers al
- Page 199 and 200:
service-sector output much more fre
- Page 201 and 202:
Box 8-1: How to Reverse a Decline i
- Page 203 and 204:
Information Protection and Statisti
- Page 205 and 206:
forward instead of the growth rate
- Page 207:
Appendix AREPORT TO THE PRESIDENT O
- Page 210 and 211:
Council Members and Their Dates of
- Page 213 and 214:
Report to the President on theActiv
- Page 215 and 216:
The Council also prepared in-depth
- Page 217 and 218:
The Staff of the Council of Economi
- Page 219: Jane Tufts, Bruce Kaplan, and Anna
- Page 223 and 224: C O N T E N T SNational Income or E
- Page 225 and 226: Prices—ContinuedPageB-63. Changes
- Page 227 and 228: General NotesDetail in these tables
- Page 229 and 230: Table B-1.—Gross domestic product
- Page 231 and 232: Table B-2.—Real gross domestic pr
- Page 233 and 234: Table B-4.—Percent changes in rea
- Page 235 and 236: Table B-5.—Contributions to perce
- Page 237 and 238: Table B-6.—Chain-type quantity in
- Page 239 and 240: Table B-7.—Chain-type price index
- Page 241 and 242: Table B-9.—Real gross domestic pr
- Page 243 and 244: Table B-11.—Real gross value adde
- Page 245 and 246: Table B-12.—Gross domestic produc
- Page 247 and 248: Table B-13.—Real gross domestic p
- Page 249 and 250: Table B-15.—Gross value added and
- Page 251 and 252: Table B-17.—Real personal consump
- Page 253 and 254: Table B-19.—Real private fixed in
- Page 255 and 256: Table B-21.—Real government consu
- Page 257 and 258: QuarterTable B-23.—Real private i
- Page 259 and 260: Table B-25.—Real exports and impo
- Page 261 and 262: Table B-27.—Relation of national
- Page 263 and 264: Table B-28.—National income by ty
- Page 265 and 266: Table B-29.—Sources of personal i
- Page 267 and 268: Table B-31.—Total and per capita
- Page 269: Table B-32.—Gross saving and inve
- Page 273 and 274: Table B-35.—Civilian population a
- Page 275 and 276: Table B-37.—Civilian employment b
- Page 277 and 278: Table B-39.—Civilian labor force
- Page 279 and 280: Table B-41.—Civilian employment/p
- Page 281 and 282: Table B-43.—Civilian unemployment
- Page 283 and 284: Table B-45.—Unemployment insuranc
- Page 285 and 286: Table B-46.—Employees on nonagric
- Page 287 and 288: Table B-48.—Employment cost index
- Page 289 and 290: Table B-50.—Changes in productivi
- Page 291 and 292: Table B-52.—Industrial production
- Page 293 and 294: Table B-54.—Capacity utilization
- Page 295 and 296: Table B-56.—New private housing u
- Page 297 and 298: Table B-58.—Manufacturers’ ship
- Page 299 and 300: PricesTable B-60.—Consumer price
- Page 301 and 302: Table B-61.—Consumer price indexe
- Page 303 and 304: Table B-63.—Changes in special co
- Page 305 and 306: Year or monthTable B-65.—Producer
- Page 307 and 308: Table B-66.—Producer price indexe
- Page 309 and 310: Table B-67.—Producer price indexe
- Page 311 and 312: Year and monthMoney Stock, Credit,
- Page 313 and 314: Table B-70.—Components of money s
- Page 315 and 316: Table B-72.—Bank credit at all co
- Page 317 and 318: Table B-73.—Bond yields and inter
- Page 319 and 320: Table B-74.—Credit market borrowi
- Page 321 and 322:
Table B-76.—Mortgage debt outstan
- Page 323 and 324:
Government FinanceTable B-78.—Fed
- Page 325 and 326:
Table B-80.—Federal receipts and
- Page 327 and 328:
Table B-82.—Federal and State and
- Page 329 and 330:
Table B-84.—Federal Government cu
- Page 331 and 332:
Table B-86.—State and local gover
- Page 333 and 334:
Table B-88.—Maturity distribution
- Page 335 and 336:
Corporate Profits and FinanceTable
- Page 337 and 338:
Table B-92.—Corporate profits of
- Page 339 and 340:
Table B-94.—Relation of profits a
- Page 341 and 342:
Year or monthTable B-96.—Common s
- Page 343 and 344:
Table B-98.—Farm business balance
- Page 345 and 346:
YearTotalTable B-100.—Farm input
- Page 347 and 348:
Table B-102.—U.S. exports and imp
- Page 349 and 350:
Table B-103.—U.S. international t
- Page 351 and 352:
Table B-105.—U.S. international t
- Page 353 and 354:
Table B-107.—International invest
- Page 355 and 356:
Table B-109.—Civilian unemploymen
- Page 357 and 358:
Table B-111.—International reserv