Table B–59.—Manufacturers’ new and unfilled orders, 1967–2007[Amounts in millions of dollars; monthly data seasonally adjusted]New orders 1 Unfilled orders 2 Unfilled orders to shipments ratio 2Year or monthTotalDurable goodsindustriesTotalCapitalgoods,nondefenseNondurablegoodsindustriesTotalDurablegoodsindustriesNondurablegoodsindustriesTotalDurablegoodsindustriesNondurablegoodsindustriesSIC: 31967 47,067 25,803 21,265 103,711 99,735 3,976 3.66 4.37 0.731968 50,657 28,051 6,314 22,606 108,377 104,393 3,984 3.79 4.58 .691969 53,990 29,876 7,046 24,114 114,341 110,161 4,180 3.71 4.45 .691970 52,022 27,340 6,072 24,682 105,008 100,412 4,596 3.61 4.36 .761971 55,921 29,905 6,682 26,016 105,247 100,225 5,022 3.32 4.00 .761972 64,182 35,038 7,745 29,144 119,349 113,034 6,315 3.26 3.85 .861973 76,003 42,627 9,926 33,376 156,561 149,204 7,357 3.80 4.51 .911974 87,327 46,862 11,594 40,465 187,043 181,519 5,524 4.09 4.93 .621975 85,139 41,957 9,886 43,181 169,546 161,664 7,882 3.69 4.45 .821976 99,513 51,307 11,490 48,206 178,128 169,857 8,271 3.24 3.88 .741977 115,109 61,035 13,681 54,073 202,024 193,323 8,701 3.24 3.85 .711978 131,629 72,278 17,588 59,351 259,169 248,281 10,888 3.57 4.20 .811979 147,604 79,483 21,154 68,121 303,593 291,321 12,272 3.89 4.62 .821980 156,359 79,392 21,135 76,967 327,416 315,202 12,214 3.85 4.58 .751981 168,025 83,654 21,806 84,371 326,547 314,707 11,840 3.87 4.68 .691982 162,140 78,064 19,213 84,077 311,887 300,798 11,089 3.84 4.74 .621983 175,451 88,140 19,624 87,311 347,273 333,114 14,159 3.53 4.29 .691984 192,879 100,164 23,669 92,715 373,529 359,651 13,878 3.60 4.37 .641985 195,706 102,356 24,545 93,351 387,196 372,097 15,099 3.67 4.47 .681986 195,204 103,647 23,982 91,557 393,515 376,699 16,816 3.59 4.41 .701987 209,389 110,809 26,094 98,579 430,426 408,688 21,738 3.63 4.43 .831988 228,270 122,076 31,108 106,194 474,154 452,150 22,004 3.64 4.46 .761989 239,572 126,055 32,988 113,516 508,849 487,098 21,751 3.96 4.85 .771990 244,507 125,583 33,331 118,924 531,131 509,124 22,007 4.15 5.15 .761991 238,805 119,849 30,471 118,957 519,199 495,802 23,397 4.08 5.07 .791992 248,212 126,308 31,524 121,905 492,893 469,381 23,512 3.51 4.30 .75NAICS: 31992 450,592 5.14 1993 246,668 128,672 40,681 425,465 4.66 1994 266,641 143,803 45,175 434,552 4.21 1995 285,542 154,137 51,011 447,095 3.97 1996 297,282 162,399 54,066 488,516 4.14 1997 314,986 174,377 60,697 512,849 4.04 1998 317,345 178,327 62,133 496,092 3.97 1999 329,770 187,674 64,392 505,589 3.76 2000 346,789 193,881 69,278 549,513 3.87 2001 322,708 173,033 58,204 513,802 4.21 2002 316,811 167,553 51,817 461,585 4.04 2003 330,369 174,302 52,891 477,029 3.92 2004 354,599 184,240 56,079 495,630 3.87 2005 394,580 201,660 65,625 570,020 3.84 2006 414,562 214,391 72,429 684,047 4.27 2007 p 216,479 74,976 808,570 2006: Jan 406,763 202,311 66,105 567,567 3.96 Feb 407,631 210,511 68,176 574,681 4.03 Mar 421,050 220,289 75,340 590,228 4.10 Apr 413,993 211,899 71,161 599,629 4.18 May 417,162 211,578 69,848 604,368 4.13 June 422,357 218,305 71,552 615,196 4.17 July 419,316 213,429 71,741 624,281 4.24 Aug 415,676 211,015 67,782 626,819 4.18 Sept 424,396 229,605 83,984 653,370 4.44 Oct 403,244 210,394 73,092 661,059 4.53 Nov 408,606 215,096 72,503 673,215 4.62 Dec 416,103 218,414 77,700 684,047 4.64 2007: Jan 398,496 205,056 64,912 687,768 4.77 Feb 400,493 206,150 68,845 693,326 4.81 Mar 416,759 216,709 78,375 706,081 4.80 Apr 418,997 218,978 78,128 719,366 4.85 May 416,866 213,829 72,788 725,644 4.85 June 420,992 217,598 77,389 737,085 4.97 July 435,099 230,502 81,119 754,340 4.93 Aug 420,076 218,362 71,417 763,051 5.06 Sept 421,206 215,348 74,935 771,803 5.17 Oct 424,145 214,256 73,022 779,374 5.22 Nov p 431,698 215,433 76,918 788,609 5.28 Dec p 226,601 81,099 808,570 1 Annual data are averages of monthly not seasonally adjusted figures.2 Unfilled orders are seasonally adjusted, end of period. Ratios are unfilled orders at end of period to shipments for period (excludes industries with nounfilled orders). Annual ratios relate to seasonally adjusted data for December.3 Effective in 2001, data classified based on North American Industry Classification System (NAICS). Data on NAICS basis available beginning with1992. Earlier data based on the Standard Industrial Classification (SIC). Data on SIC basis include semiconductors. Data on NAICS basis do not includesemiconductors.Note.—For NAICS basis data beginning with 1992, because there are no unfilled orders for manufacturers’ nondurable goods, manufacturers’ nondurablenew orders and nondurable shipments are the same (see Table B–58).Source: Department of Commerce (Bureau of the Census).294 | Economic Report of the <strong>President</strong>
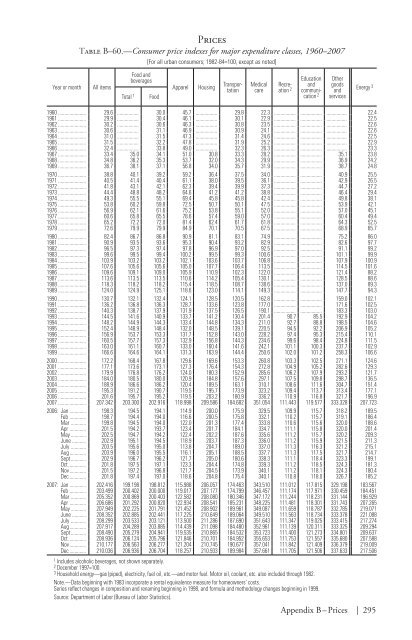
PricesTable B–60.—Consumer price indexes for major expenditure classes, 1960–2007[For all urban consumers; 1982-84=100, except as noted]Year or monthAll itemsTotal 1Food andbeveragesFoodApparelHousingMedicalcareTransportationRecreation2Educationandcommunication2OthergoodsandservicesEnergy 31960 29.6 30.0 45.7 29.8 22.3 22.41961 29.9 30.4 46.1 30.1 22.9 22.51962 30.2 30.6 46.3 30.8 23.5 22.61963 30.6 31.1 46.9 30.9 24.1 22.61964 31.0 31.5 47.3 31.4 24.6 22.51965 31.5 32.2 47.8 31.9 25.2 22.91966 32.4 33.8 49.0 32.3 26.3 23.31967 33.4 35.0 34.1 51.0 30.8 33.3 28.2 35.1 23.81968 34.8 36.2 35.3 53.7 32.0 34.3 29.9 36.9 24.21969 36.7 38.1 37.1 56.8 34.0 35.7 31.9 38.7 24.81970 38.8 40.1 39.2 59.2 36.4 37.5 34.0 40.9 25.51971 40.5 41.4 40.4 61.1 38.0 39.5 36.1 42.9 26.51972 41.8 43.1 42.1 62.3 39.4 39.9 37.3 44.7 27.21973 44.4 48.8 48.2 64.6 41.2 41.2 38.8 46.4 29.41974 49.3 55.5 55.1 69.4 45.8 45.8 42.4 49.8 38.11975 53.8 60.2 59.8 72.5 50.7 50.1 47.5 53.9 42.11976 56.9 62.1 61.6 75.2 53.8 55.1 52.0 57.0 45.11977 60.6 65.8 65.5 78.6 57.4 59.0 57.0 60.4 49.41978 65.2 72.2 72.0 81.4 62.4 61.7 61.8 64.3 52.51979 72.6 79.9 79.9 84.9 70.1 70.5 67.5 68.9 65.71980 82.4 86.7 86.8 90.9 81.1 83.1 74.9 75.2 86.01981 90.9 93.5 93.6 95.3 90.4 93.2 82.9 82.6 97.71982 96.5 97.3 97.4 97.8 96.9 97.0 92.5 91.1 99.21983 99.6 99.5 99.4 100.2 99.5 99.3 100.6 101.1 99.91984 103.9 103.2 103.2 102.1 103.6 103.7 106.8 107.9 100.91985 107.6 105.6 105.6 105.0 107.7 106.4 113.5 114.5 101.61986 109.6 109.1 109.0 105.9 110.9 102.3 122.0 121.4 88.21987 113.6 113.5 113.5 110.6 114.2 105.4 130.1 128.5 88.61988 118.3 118.2 118.2 115.4 118.5 108.7 138.6 137.0 89.31989 124.0 124.9 125.1 118.6 123.0 114.1 149.3 147.7 94.31990 130.7 132.1 132.4 124.1 128.5 120.5 162.8 159.0 102.11991 136.2 136.8 136.3 128.7 133.6 123.8 177.0 171.6 102.51992 140.3 138.7 137.9 131.9 137.5 126.5 190.1 183.3 103.01993 144.5 141.6 140.9 133.7 141.2 130.4 201.4 90.7 85.5 192.9 104.21994 148.2 144.9 144.3 133.4 144.8 134.3 211.0 92.7 88.8 198.5 104.61995 152.4 148.9 148.4 132.0 148.5 139.1 220.5 94.5 92.2 206.9 105.21996 156.9 153.7 153.3 131.7 152.8 143.0 228.2 97.4 95.3 215.4 110.11997 160.5 157.7 157.3 132.9 156.8 144.3 234.6 99.6 98.4 224.8 111.51998 163.0 161.1 160.7 133.0 160.4 141.6 242.1 101.1 100.3 237.7 102.91999 166.6 164.6 164.1 131.3 163.9 144.4 250.6 102.0 101.2 258.3 106.62000 172.2 168.4 167.8 129.6 169.6 153.3 260.8 103.3 102.5 271.1 124.62001 177.1 173.6 173.1 127.3 176.4 154.3 272.8 104.9 105.2 282.6 129.32002 179.9 176.8 176.2 124.0 180.3 152.9 285.6 106.2 107.9 293.2 121.72003 184.0 180.5 180.0 120.9 184.8 157.6 297.1 107.5 109.8 298.7 136.52004 188.9 186.6 186.2 120.4 189.5 163.1 310.1 108.6 111.6 304.7 151.42005 195.3 191.2 190.7 119.5 195.7 173.9 323.2 109.4 113.7 313.4 177.12006 201.6 195.7 195.2 119.5 203.2 180.9 336.2 110.9 116.8 321.7 196.92007 207.342 203.300 202.916 118.998 209.586 184.682 351.054 111.443 119.577 333.328 207.7232006: Jan 198.3 194.5 194.1 114.9 200.0 175.9 329.5 109.9 115.7 318.2 189.5Feb 198.7 194.4 194.0 116.6 200.5 175.8 332.1 110.2 115.7 319.1 186.4Mar 199.8 194.5 194.0 122.0 201.3 177.4 333.8 110.6 115.6 320.0 188.6Apr 201.5 194.2 193.7 123.4 201.7 184.1 334.7 111.1 115.8 320.0 201.4May 202.5 194.7 194.2 122.4 202.2 187.6 335.6 111.2 115.7 320.2 209.3June 202.9 195.1 194.5 118.9 203.7 187.3 336.0 111.2 115.9 321.5 211.3July 203.5 195.6 195.0 113.8 204.7 189.0 337.0 111.3 116.3 321.2 215.1Aug 203.9 196.0 195.5 116.1 205.1 188.5 337.7 111.3 117.5 321.7 214.7Sept 202.9 196.7 196.2 121.7 205.0 180.6 338.3 111.1 118.4 323.3 199.1Oct 201.8 197.5 197.1 123.3 204.4 174.8 339.3 111.2 118.5 324.3 181.3Nov 201.5 197.2 196.8 121.7 204.5 173.9 340.1 111.2 118.1 324.3 180.4Dec 201.8 197.4 197.0 118.6 204.8 175.4 340.1 110.8 118.0 326.7 185.22007: Jan 202.416 199.198 198.812 115.988 206.057 174.463 343.510 111.012 117.815 329.198 183.567Feb 203.499 200.402 200.000 119.017 207.177 174.799 346.457 111.174 117.971 330.459 184.451Mar 205.352 200.869 200.403 122.582 208.080 180.346 347.172 111.244 118.231 331.144 196.929Apr 206.686 201.292 200.820 122.934 208.541 185.231 348.225 111.481 118.301 331.743 207.265May 207.949 202.225 201.791 121.452 208.902 189.961 349.087 111.659 118.787 332.785 219.071June 208.352 202.885 202.441 117.225 210.649 189.064 349.510 111.563 118.734 333.378 221.088July 208.299 203.533 203.121 113.500 211.286 187.690 351.643 111.347 119.025 333.415 217.274Aug 207.917 204.289 203.885 114.439 211.098 184.480 352.961 111.139 120.311 333.325 209.294Sept 208.490 205.279 204.941 119.535 210.865 184.532 353.723 111.400 121.273 334.801 209.637Oct 208.936 206.124 205.796 121.846 210.701 184.952 355.653 111.753 121.557 335.680 207.588Nov 210.177 206.563 206.277 121.204 210.745 190.677 357.041 111.842 121.409 336.379 219.009Dec 210.036 206.936 206.704 118.257 210.933 189.984 357.661 111.705 121.506 337.633 217.5061 Includes alcoholic beverages, not shown separately.2 December 1997=100.3 Household energy—gas (piped), electricity, fuel oil, etc.—and motor fuel. Motor oil, coolant, etc. also included through 1982.Note.—Data beginning with 1983 incorporate a rental equivalence measure for homeowners’ costs.Series reflect changes in composition and renaming beginning in 1998, and formula and methodology changes beginning in 1999.Source: Department of Labor (Bureau of Labor Statistics).Appendix B – Prices | 295
- Page 1 and 2:
EconomicReportof thePresidentTransm
- Page 4 and 5:
C O N T E N T SPageECONOMIC REPORT
- Page 7 and 8:
ECONOMIC REPORT OF THE PRESIDENTTo
- Page 9:
$2 billion to a new international c
- Page 13:
LETTER OF TRANSMITTALCouncil of Eco
- Page 16 and 17:
chapter 3. the causes and consequen
- Page 18 and 19:
appendixesA. Report to the Presiden
- Page 20 and 21:
2-5. Mortgage Lending Today........
- Page 22 and 23:
Chapter 1: The Year in Reviewand th
- Page 24 and 25:
Chapter 3: The Causes and Consequen
- Page 26 and 27:
• Tax reductions in 2001 and 2003
- Page 28 and 29:
• More effective statistical use
- Page 30 and 31:
• Real GDP posted solid 2.5 perce
- Page 32 and 33:
elative to non-energy prices, while
- Page 34 and 35:
nonconforming mortgages in 2007. In
- Page 36 and 37:
In addition to incomes and mortgage
- Page 38 and 39:
Business InventoriesInventory inves
- Page 40 and 41:
Indeed, the growth in foreign econo
- Page 42 and 43:
During the 12 months of 2007, the u
- Page 44 and 45:
output measures announced in the an
- Page 46 and 47:
and government purchases. In contra
- Page 48 and 49:
Table 1-1.—Administration Economi
- Page 50 and 51:
Box 1-3 — continuedParticipation
- Page 52 and 53:
finalized), below its 1963-2006 ave
- Page 55 and 56:
C H A P T E R 2Credit and Housing M
- Page 57 and 58:
lends a debtor money today, which t
- Page 59 and 60:
Box 2-1 — continuedPrime loan: Lo
- Page 61 and 62:
Box 2-2 — continuedNRSROs. Critic
- Page 63 and 64:
Box 2-3 — continuedMortgage defau
- Page 65 and 66:
Box 2-3 — continuedmortgage defau
- Page 67 and 68:
Corporate bond yields also rose rel
- Page 69 and 70:
conduits in that SIVs have less acc
- Page 71 and 72:
International ImplicationsA notable
- Page 73 and 74:
come together to create a coordinat
- Page 75 and 76:
home is forgiven, that portion is t
- Page 77 and 78:
alternatives offered in the convent
- Page 79 and 80:
to such a change in wealth, which a
- Page 81:
lending. FHA Modernization will enc
- Page 84 and 85:
Economists often call attention to
- Page 86 and 87:
Box 3-1: Trade in ServicesDiscussio
- Page 88 and 89:
Box 3-2: The Current Account Defici
- Page 90 and 91:
Growth in Domestic ProductionA seco
- Page 92 and 93:
Exports and Foreign Direct Investme
- Page 94 and 95:
in CFIUS’s role in protecting nat
- Page 96 and 97:
these goods than if they were produ
- Page 98 and 99:
y import competition are electrical
- Page 101 and 102:
C H A P T E R 4The Importance of He
- Page 103 and 104:
Box 4-1: Health Effects on Job Prod
- Page 105 and 106:
health care spending growth. Rising
- Page 107 and 108:
While the study focused on spending
- Page 109 and 110:
Box 4-2 — continuedand without pr
- Page 111 and 112:
effective price of zero. Even if a
- Page 113 and 114:
deduction for health insurance to a
- Page 115 and 116:
To reduce the extent to which high-
- Page 117 and 118:
Administration supports broad adopt
- Page 119 and 120:
C H A P T E R 5Tax PolicySocieties
- Page 121 and 122:
in 2000. Tax revenues increased str
- Page 123 and 124:
Alternative Minimum TaxPrior to 196
- Page 125 and 126:
The Impact of Recent Tax Reductions
- Page 127 and 128:
35 percent marginal tax rate on the
- Page 129 and 130:
C corporations fall under the corpo
- Page 131 and 132:
Significance of Tax Cuts to Individ
- Page 133 and 134:
Box 5-1: Marriage Penalty BasicsIt
- Page 135 and 136:
The Structure of Business TaxesDesp
- Page 137 and 138:
investments are made. A more modest
- Page 139 and 140:
able to defer $35 of tax liability
- Page 141 and 142:
C H A P T E R 6The Nation’s Infra
- Page 143 and 144:
A monopolistic bridge owner may cho
- Page 145 and 146:
etween places to accommodating grow
- Page 147 and 148:
the same time. At hours when many d
- Page 149 and 150:
BridgesOn August 1, 2007, the I-35W
- Page 151 and 152:
where shippers have an alternative
- Page 153 and 154:
Freight shipments into and out of t
- Page 155 and 156:
Box 6-2: Delays at New York City Ai
- Page 157 and 158:
uilt, the marginal cost of transmis
- Page 159 and 160:
access was in mobile wireless conne
- Page 161 and 162:
Infrastructure PolicyThough the U.S
- Page 163 and 164:
could shorten the wait by adding an
- Page 165 and 166:
In 2005, the Federal Aviation Admin
- Page 167 and 168:
C H A P T E R 7Searching for Altern
- Page 169 and 170:
The first U.S. oil well was drilled
- Page 171 and 172:
Most of the oil consumed in the Uni
- Page 173 and 174:
Also, depending on the fuel and tec
- Page 175 and 176:
Table 7-1. —Estimated Average Lev
- Page 177 and 178:
Nevada. The facility is expected to
- Page 179 and 180:
Wind PowerWind power supplies about
- Page 181 and 182:
amounts of electricity, it could be
- Page 183 and 184:
years, as corn-based ethanol produc
- Page 185 and 186:
the power, range, and convenient fu
- Page 187 and 188:
other petroleum products is project
- Page 189 and 190:
To help meet the growing demand for
- Page 191 and 192:
C H A P T E R 8Improving Economic S
- Page 193 and 194:
The second largest Federal statisti
- Page 195 and 196:
As shown in Chart 8-3, spending on
- Page 197 and 198:
Monetary and fiscal policymakers al
- Page 199 and 200:
service-sector output much more fre
- Page 201 and 202:
Box 8-1: How to Reverse a Decline i
- Page 203 and 204:
Information Protection and Statisti
- Page 205 and 206:
forward instead of the growth rate
- Page 207:
Appendix AREPORT TO THE PRESIDENT O
- Page 210 and 211:
Council Members and Their Dates of
- Page 213 and 214:
Report to the President on theActiv
- Page 215 and 216:
The Council also prepared in-depth
- Page 217 and 218:
The Staff of the Council of Economi
- Page 219:
Jane Tufts, Bruce Kaplan, and Anna
- Page 223 and 224:
C O N T E N T SNational Income or E
- Page 225 and 226:
Prices—ContinuedPageB-63. Changes
- Page 227 and 228:
General NotesDetail in these tables
- Page 229 and 230:
Table B-1.—Gross domestic product
- Page 231 and 232:
Table B-2.—Real gross domestic pr
- Page 233 and 234:
Table B-4.—Percent changes in rea
- Page 235 and 236:
Table B-5.—Contributions to perce
- Page 237 and 238:
Table B-6.—Chain-type quantity in
- Page 239 and 240:
Table B-7.—Chain-type price index
- Page 241 and 242:
Table B-9.—Real gross domestic pr
- Page 243 and 244:
Table B-11.—Real gross value adde
- Page 245 and 246:
Table B-12.—Gross domestic produc
- Page 247 and 248: Table B-13.—Real gross domestic p
- Page 249 and 250: Table B-15.—Gross value added and
- Page 251 and 252: Table B-17.—Real personal consump
- Page 253 and 254: Table B-19.—Real private fixed in
- Page 255 and 256: Table B-21.—Real government consu
- Page 257 and 258: QuarterTable B-23.—Real private i
- Page 259 and 260: Table B-25.—Real exports and impo
- Page 261 and 262: Table B-27.—Relation of national
- Page 263 and 264: Table B-28.—National income by ty
- Page 265 and 266: Table B-29.—Sources of personal i
- Page 267 and 268: Table B-31.—Total and per capita
- Page 269 and 270: Table B-32.—Gross saving and inve
- Page 271 and 272: Population, Employment, Wages, and
- Page 273 and 274: Table B-35.—Civilian population a
- Page 275 and 276: Table B-37.—Civilian employment b
- Page 277 and 278: Table B-39.—Civilian labor force
- Page 279 and 280: Table B-41.—Civilian employment/p
- Page 281 and 282: Table B-43.—Civilian unemployment
- Page 283 and 284: Table B-45.—Unemployment insuranc
- Page 285 and 286: Table B-46.—Employees on nonagric
- Page 287 and 288: Table B-48.—Employment cost index
- Page 289 and 290: Table B-50.—Changes in productivi
- Page 291 and 292: Table B-52.—Industrial production
- Page 293 and 294: Table B-54.—Capacity utilization
- Page 295 and 296: Table B-56.—New private housing u
- Page 297: Table B-58.—Manufacturers’ ship
- Page 301 and 302: Table B-61.—Consumer price indexe
- Page 303 and 304: Table B-63.—Changes in special co
- Page 305 and 306: Year or monthTable B-65.—Producer
- Page 307 and 308: Table B-66.—Producer price indexe
- Page 309 and 310: Table B-67.—Producer price indexe
- Page 311 and 312: Year and monthMoney Stock, Credit,
- Page 313 and 314: Table B-70.—Components of money s
- Page 315 and 316: Table B-72.—Bank credit at all co
- Page 317 and 318: Table B-73.—Bond yields and inter
- Page 319 and 320: Table B-74.—Credit market borrowi
- Page 321 and 322: Table B-76.—Mortgage debt outstan
- Page 323 and 324: Government FinanceTable B-78.—Fed
- Page 325 and 326: Table B-80.—Federal receipts and
- Page 327 and 328: Table B-82.—Federal and State and
- Page 329 and 330: Table B-84.—Federal Government cu
- Page 331 and 332: Table B-86.—State and local gover
- Page 333 and 334: Table B-88.—Maturity distribution
- Page 335 and 336: Corporate Profits and FinanceTable
- Page 337 and 338: Table B-92.—Corporate profits of
- Page 339 and 340: Table B-94.—Relation of profits a
- Page 341 and 342: Year or monthTable B-96.—Common s
- Page 343 and 344: Table B-98.—Farm business balance
- Page 345 and 346: YearTotalTable B-100.—Farm input
- Page 347 and 348: Table B-102.—U.S. exports and imp
- Page 349 and 350:
Table B-103.—U.S. international t
- Page 351 and 352:
Table B-105.—U.S. international t
- Page 353 and 354:
Table B-107.—International invest
- Page 355 and 356:
Table B-109.—Civilian unemploymen
- Page 357 and 358:
Table B-111.—International reserv