

President
ERP_Cover_Proofs with green barcode.indd - The American ...
ERP_Cover_Proofs with green barcode.indd - The American ...

You also want an ePaper? Increase the reach of your titles
YUMPU automatically turns print PDFs into web optimized ePapers that Google loves.
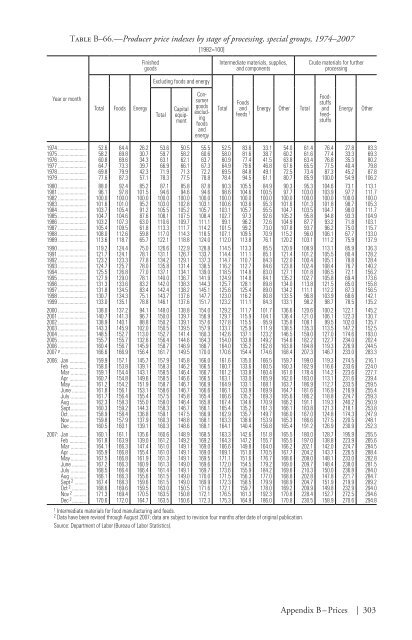
Table B–66.—Producer price indexes by stage of processing, special groups, 1974–2007[1982=100]FinishedgoodsExcluding foods and energyIntermediate materials, supplies,and componentsCrude materials for furtherprocessingYear or monthTotal Foods EnergyTotalCapitalequipmentConsumergoodsexcludingfoodsandenergyTotalFoodsand Energy Other Totalfeeds 11974 52.6 64.4 26.2 53.6 50.5 55.5 52.5 83.6 33.1 54.0 61.4 76.4 27.8 83.31975 58.2 69.8 30.7 59.7 58.2 60.6 58.0 81.6 38.7 60.2 61.6 77.4 33.3 69.31976 60.8 69.6 34.3 63.1 62.1 63.7 60.9 77.4 41.5 63.8 63.4 76.8 35.3 80.21977 64.7 73.3 39.7 66.9 66.1 67.3 64.9 79.6 46.8 67.6 65.5 77.5 40.4 79.81978 69.8 79.9 42.3 71.9 71.3 72.2 69.5 84.8 49.1 72.5 73.4 87.3 45.2 87.81979 77.6 87.3 57.1 78.3 77.5 78.8 78.4 94.5 61.1 80.7 85.9 100.0 54.9 106.21980 88.0 92.4 85.2 87.1 85.8 87.8 90.3 105.5 84.9 90.3 95.3 104.6 73.1 113.11981 96.1 97.8 101.5 94.6 94.6 94.6 98.6 104.6 100.5 97.7 103.0 103.9 97.7 111.71982 100.0 100.0 100.0 100.0 100.0 100.0 100.0 100.0 100.0 100.0 100.0 100.0 100.0 100.01983 101.6 101.0 95.2 103.0 102.8 103.1 100.6 103.6 95.3 101.6 101.3 101.8 98.7 105.31984 103.7 105.4 91.2 105.5 105.2 105.7 103.1 105.7 95.5 104.7 103.5 104.7 98.0 111.71985 104.7 104.6 87.6 108.1 107.5 108.4 102.7 97.3 92.6 105.2 95.8 94.8 93.3 104.91986 103.2 107.3 63.0 110.6 109.7 111.1 99.1 96.2 72.6 104.9 87.7 93.2 71.8 103.11987 105.4 109.5 61.8 113.3 111.7 114.2 101.5 99.2 73.0 107.8 93.7 96.2 75.0 115.71988 108.0 112.6 59.8 117.0 114.3 118.5 107.1 109.5 70.9 115.2 96.0 106.1 67.7 133.01989 113.6 118.7 65.7 122.1 118.8 124.0 112.0 113.8 76.1 120.2 103.1 111.2 75.9 137.91990 119.2 124.4 75.0 126.6 122.9 128.8 114.5 113.3 85.5 120.9 108.9 113.1 85.9 136.31991 121.7 124.1 78.1 131.1 126.7 133.7 114.4 111.1 85.1 121.4 101.2 105.5 80.4 128.21992 123.2 123.3 77.8 134.2 129.1 137.3 114.7 110.7 84.3 122.0 100.4 105.1 78.8 128.41993 124.7 125.7 78.0 135.8 131.4 138.5 116.2 112.7 84.6 123.8 102.4 108.4 76.7 140.21994 125.5 126.8 77.0 137.1 134.1 139.0 118.5 114.8 83.0 127.1 101.8 106.5 72.1 156.21995 127.9 129.0 78.1 140.0 136.7 141.9 124.9 114.8 84.1 135.2 102.7 105.8 69.4 173.61996 131.3 133.6 83.2 142.0 138.3 144.3 125.7 128.1 89.8 134.0 113.8 121.5 85.0 155.81997 131.8 134.5 83.4 142.4 138.2 145.1 125.6 125.4 89.0 134.2 111.1 112.2 87.3 156.51998 130.7 134.3 75.1 143.7 137.6 147.7 123.0 116.2 80.8 133.5 96.8 103.9 68.6 142.11999 133.0 135.1 78.8 146.1 137.6 151.7 123.2 111.1 84.3 133.1 98.2 98.7 78.5 135.22000 138.0 137.2 94.1 148.0 138.8 154.0 129.2 111.7 101.7 136.6 120.6 100.2 122.1 145.22001 140.7 141.3 96.7 150.0 139.7 156.9 129.7 115.9 104.1 136.4 121.0 106.1 122.3 130.72002 138.9 140.1 88.8 150.2 139.1 157.6 127.8 115.5 95.9 135.8 108.1 99.5 102.0 135.72003 143.3 145.9 102.0 150.5 139.5 157.9 133.7 125.9 111.9 138.5 135.3 113.5 147.2 152.52004 148.5 152.7 113.0 152.7 141.4 160.3 142.6 137.1 123.2 146.5 159.0 127.0 174.6 193.02005 155.7 155.7 132.6 156.4 144.6 164.3 154.0 133.8 149.2 154.6 182.2 122.7 234.0 202.42006 160.4 156.7 145.9 158.7 146.9 166.7 164.0 135.2 162.8 163.8 184.8 119.3 226.9 244.52007 p 166.6 166.9 156.4 161.7 149.5 170.0 170.6 154.4 174.6 168.4 207.3 146.7 233.0 283.32006: Jan 159.9 157.1 145.7 157.9 145.8 166.0 161.6 135.0 166.5 159.7 199.0 119.3 274.5 216.1Feb 158.0 153.8 139.1 158.3 146.2 166.5 160.7 133.6 160.5 160.3 182.9 116.6 233.6 224.0Mar 159.1 154.4 143.1 158.5 146.4 166.7 161.2 133.8 160.4 161.0 178.4 114.2 223.6 227.7Apr 160.7 154.8 149.6 158.5 146.6 166.5 163.1 133.0 165.9 162.0 183.0 113.1 231.6 239.4May 161.2 154.2 151.9 158.7 146.7 166.9 164.9 133.1 168.1 163.7 186.9 112.7 233.5 259.5June 161.8 156.1 153.1 158.6 146.7 166.6 166.1 133.9 169.9 164.7 181.6 116.9 216.9 255.4July 161.7 156.4 155.4 157.5 145.8 165.4 166.6 135.2 169.3 165.6 186.2 118.8 224.7 259.3Aug 162.3 158.3 155.0 158.0 146.4 165.8 167.4 134.6 170.9 166.2 191.1 119.3 240.2 250.9Sept 160.3 159.2 144.3 158.3 146.7 166.1 165.4 135.2 161.3 166.1 183.8 121.3 218.1 253.8Oct 158.9 158.4 136.8 159.1 147.5 166.9 162.9 135.7 149.7 166.0 167.0 124.8 174.3 247.9Nov 159.8 157.9 137.9 160.3 148.8 168.1 163.3 138.6 153.9 165.3 186.6 127.5 220.5 248.1Dec 160.5 160.1 139.1 160.3 148.6 168.1 164.1 140.4 156.8 165.4 191.2 126.9 230.9 252.32007: Jan 160.1 161.1 135.6 160.6 148.9 168.5 163.3 142.6 151.8 165.5 180.0 128.7 195.9 255.5Feb 161.8 163.9 139.0 161.2 149.2 169.2 164.3 147.2 155.7 165.5 197.0 138.8 223.9 265.6Mar 164.1 166.3 147.4 161.0 149.1 169.0 166.6 149.8 164.0 166.2 202.1 142.0 224.7 284.5Apr 165.9 166.8 155.4 161.0 149.1 169.0 169.1 151.0 170.5 167.7 204.2 143.7 226.5 288.4May 167.5 166.8 161.9 161.3 149.1 169.5 171.1 151.6 176.7 168.6 208.0 148.1 233.0 282.8June 167.2 166.3 160.9 161.3 149.0 169.6 172.0 154.5 179.2 169.0 209.7 148.4 238.0 281.5July 168.5 166.4 166.4 161.4 149.1 169.7 173.6 155.9 184.2 169.6 210.3 150.0 236.8 284.0Aug 166.1 166.3 155.6 161.5 149.0 170.0 171.5 156.3 177.0 168.8 202.8 147.8 221.7 284.7Sept 2 167.4 168.3 159.6 161.5 149.0 169.9 172.3 158.5 179.9 168.9 204.7 151.9 219.9 289.2Oct 2 168.6 169.6 159.5 163.0 150.5 171.6 172.1 159.7 178.0 169.2 209.9 149.8 232.9 294.0Nov 2 171.3 169.4 170.5 163.5 150.8 172.1 176.5 161.3 192.3 170.8 228.4 152.7 272.5 294.6Dec 2 170.6 172.0 164.7 163.5 150.6 172.3 175.3 164.9 186.0 170.8 230.5 158.9 270.6 294.81 Intermediate materials for food manufacturing and feeds.2 Data have been revised through August 2007; data are subject to revision four months after date of original publication.Source: Department of Labor (Bureau of Labor Statistics).FoodstuffsandfeedstuffsEnergyOtherAppendix B – Prices | 303


