Table B–38.—Unemployment by demographic characteristic, 1960–2007[Thousands of persons 16 years of age and over; monthly data seasonally adjusted]Year or monthAllcivilianworkersTotal Males FemalesWhite 1 Black and other 1 Black or African American 1Bothsexes16-19Total Males FemalesBothsexes16-19Total Males FemalesBothsexes16-191960 3,852 3,065 1,988 1,077 575 788 498 290 138 1961 4,714 3,743 2,398 1,345 669 971 599 372 159 1962 3,911 3,052 1,915 1,137 580 861 509 352 142 1963 4,070 3,208 1,976 1,232 708 863 496 367 176 1964 3,786 2,999 1,779 1,220 708 787 426 361 165 1965 3,366 2,691 1,556 1,135 705 678 360 318 171 1966 2,875 2,255 1,241 1,014 651 622 310 312 186 1967 2,975 2,338 1,208 1,130 635 638 300 338 203 1968 2,817 2,226 1,142 1,084 644 590 277 313 194 1969 2,832 2,260 1,137 1,123 660 571 267 304 193 1970 4,093 3,339 1,857 1,482 871 754 380 374 235 1971 5,016 4,085 2,309 1,777 1,011 930 481 450 249 1972 4,882 3,906 2,173 1,733 1,021 977 486 491 288 906 448 458 2791973 4,365 3,442 1,836 1,606 955 924 440 484 280 846 395 451 2621974 5,156 4,097 2,169 1,927 1,104 1,058 544 514 318 965 494 470 2971975 7,929 6,421 3,627 2,794 1,413 1,507 815 692 355 1,369 741 629 3301976 7,406 5,914 3,258 2,656 1,364 1,492 779 713 355 1,334 698 637 3301977 6,991 5,441 2,883 2,558 1,284 1,550 784 766 379 1,393 698 695 3541978 6,202 4,698 2,411 2,287 1,189 1,505 731 774 394 1,330 641 690 3601979 6,137 4,664 2,405 2,260 1,193 1,473 714 759 362 1,319 636 683 3331980 7,637 5,884 3,345 2,540 1,291 1,752 922 830 377 1,553 815 738 3431981 8,273 6,343 3,580 2,762 1,374 1,930 997 933 388 1,731 891 840 3571982 10,678 8,241 4,846 3,395 1,534 2,437 1,334 1,104 443 2,142 1,167 975 3961983 10,717 8,128 4,859 3,270 1,387 2,588 1,401 1,187 441 2,272 1,213 1,059 3921984 8,539 6,372 3,600 2,772 1,116 2,167 1,144 1,022 384 1,914 1,003 911 3531985 8,312 6,191 3,426 2,765 1,074 2,121 1,095 1,026 394 1,864 951 913 3571986 8,237 6,140 3,433 2,708 1,070 2,097 1,097 999 383 1,840 946 894 3471987 7,425 5,501 3,132 2,369 995 1,924 969 955 353 1,684 826 858 3121988 6,701 4,944 2,766 2,177 910 1,757 888 869 316 1,547 771 776 2881989 6,528 4,770 2,636 2,135 863 1,757 889 868 331 1,544 773 772 3001990 7,047 5,186 2,935 2,251 903 1,860 971 889 308 1,565 806 758 2681991 8,628 6,560 3,859 2,701 1,029 2,068 1,087 981 330 1,723 890 833 2801992 9,613 7,169 4,209 2,959 1,037 2,444 1,314 1,130 390 2,011 1,067 944 3241993 8,940 6,655 3,828 2,827 992 2,285 1,227 1,058 373 1,844 971 872 3131994 7,996 5,892 3,275 2,617 960 2,104 1,092 1,011 360 1,666 848 818 3001995 7,404 5,459 2,999 2,460 952 1,945 984 961 394 1,538 762 777 3251996 7,236 5,300 2,896 2,404 939 1,936 984 952 367 1,592 808 784 3101997 6,739 4,836 2,641 2,195 912 1,903 935 967 359 1,560 747 813 3021998 6,210 4,484 2,431 2,053 876 1,726 835 891 329 1,426 671 756 2811999 5,880 4,273 2,274 1,999 844 1,606 792 814 318 1,309 626 684 2682000 5,692 4,121 2,177 1,944 795 1,241 620 621 2302001 6,801 4,969 2,754 2,215 845 1,416 709 706 2602002 8,378 6,137 3,459 2,678 925 1,693 835 858 2602003 8,774 6,311 3,643 2,668 909 1,787 891 895 2552004 8,149 5,847 3,282 2,565 890 1,729 860 868 2412005 7,591 5,350 2,931 2,419 845 1,700 844 856 2672006 7,001 5,002 2,730 2,271 794 1,549 774 775 2532007 7,078 5,143 2,869 2,274 805 1,445 752 693 2352006: Jan 7,025 5,065 2,761 2,304 789 1,513 675 837 239Feb 7,143 5,067 2,763 2,304 769 1,627 794 833 280Mar 7,075 4,962 2,693 2,269 777 1,629 790 839 307Apr 7,113 5,017 2,764 2,252 743 1,608 816 792 253May 7,038 5,055 2,830 2,225 759 1,524 813 710 216June 7,017 5,036 2,755 2,281 819 1,516 756 760 241July 7,176 5,061 2,748 2,313 791 1,659 858 801 286Aug 7,128 5,106 2,808 2,298 860 1,528 782 747 242Sept 6,896 4,882 2,570 2,311 816 1,574 788 787 273Oct 6,735 4,865 2,626 2,239 798 1,471 782 689 246Nov 6,820 4,899 2,647 2,252 775 1,488 751 736 239Dec 6,760 4,938 2,767 2,170 811 1,455 674 781 2132007: Jan 7,043 5,154 2,871 2,284 791 1,415 727 688 246Feb 6,837 4,986 2,832 2,154 772 1,394 733 661 241Mar 6,738 4,787 2,638 2,149 776 1,439 790 648 194Apr 6,829 4,928 2,731 2,197 773 1,435 793 642 258May 6,863 4,928 2,741 2,187 801 1,466 778 688 242June 6,997 5,083 2,839 2,244 834 1,467 775 692 252July 7,137 5,232 2,921 2,311 800 1,421 711 710 206Aug 7,133 5,256 2,935 2,322 806 1,347 660 687 238Sept 7,246 5,324 3,048 2,275 834 1,437 718 719 220Oct 7,291 5,268 2,959 2,309 810 1,483 776 708 215Nov 7,181 5,235 2,908 2,327 840 1,473 756 717 234Dec 7,655 5,571 3,042 2,529 815 1,577 829 748 2951 See footnote 1 and Note, Table B–37.Note.—See footnote 5 and Note, Table B–35.Source: Department of Labor (Bureau of Labor Statistics).272 | Economic Report of the <strong>President</strong>
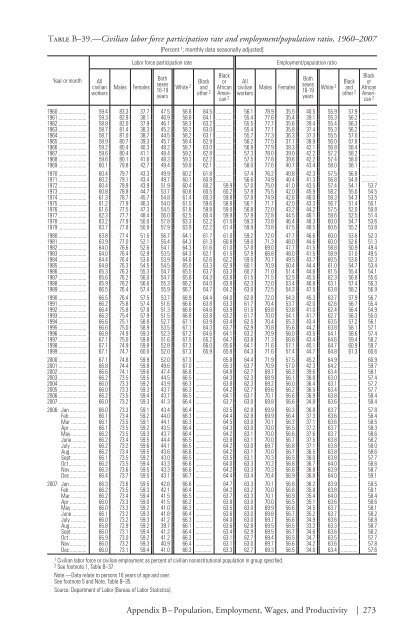
Table B–39.—Civilian labor force participation rate and employment/population ratio, 1960–2007[Percent 1 ; monthly data seasonally adjusted]Labor force participation rateEmployment/population ratioYear or monthAllcivilianworkersMalesFemalesBothsexes16-19yearsWhite 2Blackandother 2BlackorAfricanAmerican2AllcivilianworkersMalesFemalesBothsexes16-19yearsWhite 2Blackandother 2BlackorAfricanAmerican21960 59.4 83.3 37.7 47.5 58.8 64.5 56.1 78.9 35.5 40.5 55.9 57.9 1961 59.3 82.9 38.1 46.9 58.8 64.1 55.4 77.6 35.4 39.1 55.3 56.2 1962 58.8 82.0 37.9 46.1 58.3 63.2 55.5 77.7 35.6 39.4 55.4 56.3 1963 58.7 81.4 38.3 45.2 58.2 63.0 55.4 77.1 35.8 37.4 55.3 56.2 1964 58.7 81.0 38.7 44.5 58.2 63.1 55.7 77.3 36.3 37.3 55.5 57.0 1965 58.9 80.7 39.3 45.7 58.4 62.9 56.2 77.5 37.1 38.9 56.0 57.8 1966 59.2 80.4 40.3 48.2 58.7 63.0 56.9 77.9 38.3 42.1 56.8 58.4 1967 59.6 80.4 41.1 48.4 59.2 62.8 57.3 78.0 39.0 42.2 57.2 58.2 1968 59.6 80.1 41.6 48.3 59.3 62.2 57.5 77.8 39.6 42.2 57.4 58.0 1969 60.1 79.8 42.7 49.4 59.9 62.1 58.0 77.6 40.7 43.4 58.0 58.1 1970 60.4 79.7 43.3 49.9 60.2 61.8 57.4 76.2 40.8 42.3 57.5 56.8 1971 60.2 79.1 43.4 49.7 60.1 60.9 56.6 74.9 40.4 41.3 56.8 54.9 1972 60.4 78.9 43.9 51.9 60.4 60.2 59.9 57.0 75.0 41.0 43.5 57.4 54.1 53.71973 60.8 78.8 44.7 53.7 60.8 60.5 60.2 57.8 75.5 42.0 45.9 58.2 55.0 54.51974 61.3 78.7 45.7 54.8 61.4 60.3 59.8 57.8 74.9 42.6 46.0 58.3 54.3 53.51975 61.2 77.9 46.3 54.0 61.5 59.6 58.8 56.1 71.7 42.0 43.3 56.7 51.4 50.11976 61.6 77.5 47.3 54.5 61.8 59.8 59.0 56.8 72.0 43.2 44.2 57.5 52.0 50.81977 62.3 77.7 48.4 56.0 62.5 60.4 59.8 57.9 72.8 44.5 46.1 58.6 52.5 51.41978 63.2 77.9 50.0 57.8 63.3 62.2 61.5 59.3 73.8 46.4 48.3 60.0 54.7 53.61979 63.7 77.8 50.9 57.9 63.9 62.2 61.4 59.9 73.8 47.5 48.5 60.6 55.2 53.81980 63.8 77.4 51.5 56.7 64.1 61.7 61.0 59.2 72.0 47.7 46.6 60.0 53.6 52.31981 63.9 77.0 52.1 55.4 64.3 61.3 60.8 59.0 71.3 48.0 44.6 60.0 52.6 51.31982 64.0 76.6 52.6 54.1 64.3 61.6 61.0 57.8 69.0 47.7 41.5 58.8 50.9 49.41983 64.0 76.4 52.9 53.5 64.3 62.1 61.5 57.9 68.8 48.0 41.5 58.9 51.0 49.51984 64.4 76.4 53.6 53.9 64.6 62.6 62.2 59.5 70.7 49.5 43.7 60.5 53.6 52.31985 64.8 76.3 54.5 54.5 65.0 63.3 62.9 60.1 70.9 50.4 44.4 61.0 54.7 53.41986 65.3 76.3 55.3 54.7 65.5 63.7 63.3 60.7 71.0 51.4 44.6 61.5 55.4 54.11987 65.6 76.2 56.0 54.7 65.8 64.3 63.8 61.5 71.5 52.5 45.5 62.3 56.8 55.61988 65.9 76.2 56.6 55.3 66.2 64.0 63.8 62.3 72.0 53.4 46.8 63.1 57.4 56.31989 66.5 76.4 57.4 55.9 66.7 64.7 64.2 63.0 72.5 54.3 47.5 63.8 58.2 56.91990 66.5 76.4 57.5 53.7 66.9 64.4 64.0 62.8 72.0 54.3 45.3 63.7 57.9 56.71991 66.2 75.8 57.4 51.6 66.6 63.8 63.3 61.7 70.4 53.7 42.0 62.6 56.7 55.41992 66.4 75.8 57.8 51.3 66.8 64.6 63.9 61.5 69.8 53.8 41.0 62.4 56.4 54.91993 66.3 75.4 57.9 51.5 66.8 63.8 63.2 61.7 70.0 54.1 41.7 62.7 56.3 55.01994 66.6 75.1 58.8 52.7 67.1 63.9 63.4 62.5 70.4 55.3 43.4 63.5 57.2 56.11995 66.6 75.0 58.9 53.5 67.1 64.3 63.7 62.9 70.8 55.6 44.2 63.8 58.1 57.11996 66.8 74.9 59.3 52.3 67.2 64.6 64.1 63.2 70.9 56.0 43.5 64.1 58.6 57.41997 67.1 75.0 59.8 51.6 67.5 65.2 64.7 63.8 71.3 56.8 43.4 64.6 59.4 58.21998 67.1 74.9 59.8 52.8 67.3 66.0 65.6 64.1 71.6 57.1 45.1 64.7 60.9 59.71999 67.1 74.7 60.0 52.0 67.3 65.9 65.8 64.3 71.6 57.4 44.7 64.8 61.3 60.62000 67.1 74.8 59.9 52.0 67.3 65.8 64.4 71.9 57.5 45.2 64.9 60.92001 66.8 74.4 59.8 49.6 67.0 65.3 63.7 70.9 57.0 42.3 64.2 59.72002 66.6 74.1 59.6 47.4 66.8 64.8 62.7 69.7 56.3 39.6 63.4 58.12003 66.2 73.5 59.5 44.5 66.5 64.3 62.3 68.9 56.1 36.8 63.0 57.42004 66.0 73.3 59.2 43.9 66.3 63.8 62.3 69.2 56.0 36.4 63.1 57.22005 66.0 73.3 59.3 43.7 66.3 64.2 62.7 69.6 56.2 36.5 63.4 57.72006 66.2 73.5 59.4 43.7 66.5 64.1 63.1 70.1 56.6 36.9 63.8 58.42007 66.0 73.2 59.3 41.3 66.4 63.7 63.0 69.8 56.6 34.8 63.6 58.42006: Jan 66.0 73.3 59.1 43.4 66.4 63.5 62.9 69.9 56.3 36.8 63.7 57.8Feb 66.1 73.4 59.2 44.0 66.3 64.4 62.9 69.9 56.4 37.3 63.6 58.4Mar 66.1 73.5 59.1 44.1 66.3 64.5 63.0 70.1 56.3 37.1 63.6 58.5Apr 66.1 73.5 59.2 43.5 66.4 64.3 63.0 70.0 56.5 37.2 63.7 58.3May 66.2 73.5 59.3 43.7 66.4 64.2 63.1 70.0 56.6 37.6 63.7 58.6June 66.2 73.4 59.5 44.4 66.5 63.8 63.1 70.0 56.7 37.5 63.8 58.2July 66.2 73.2 59.6 44.1 66.5 64.2 63.0 69.7 56.8 37.1 63.8 58.0Aug 66.2 73.4 59.5 43.6 66.6 64.2 63.1 70.0 56.7 36.5 63.8 58.6Sept 66.1 73.5 59.2 43.0 66.5 63.5 63.1 70.3 56.5 36.0 63.8 57.7Oct 66.2 73.5 59.4 43.3 66.6 64.0 63.3 70.2 56.8 36.7 64.0 58.6Nov 66.3 73.6 59.5 43.3 66.6 64.2 63.3 70.3 56.8 36.8 63.9 58.7Dec 66.4 73.7 59.5 43.1 66.7 64.4 63.4 70.4 56.9 36.8 64.0 59.12007: Jan 66.3 73.6 59.5 42.6 66.6 64.7 63.3 70.1 56.8 36.2 63.9 59.5Feb 66.2 73.5 59.3 42.1 66.4 64.2 63.2 70.0 56.8 35.8 63.8 59.1Mar 66.2 73.4 59.4 41.5 66.5 63.7 63.3 70.1 56.9 35.4 64.0 58.4Apr 66.0 73.3 59.0 41.5 66.2 63.8 63.0 70.0 56.5 35.1 63.6 58.6May 66.0 73.3 59.2 41.0 66.3 63.5 63.0 69.9 56.6 34.5 63.7 58.1June 66.1 73.2 59.3 41.8 66.4 63.6 63.0 69.8 56.7 35.2 63.7 58.2July 66.0 73.2 59.3 41.2 66.3 64.0 63.0 69.7 56.6 34.9 63.6 58.8Aug 65.8 72.9 59.2 39.7 66.1 63.6 62.8 69.5 56.5 33.2 63.3 58.7Sept 66.0 73.1 59.4 41.2 66.4 63.4 62.9 69.5 56.7 34.6 63.6 58.2Oct 65.9 73.0 59.2 41.2 66.3 63.1 62.7 69.4 56.5 34.7 63.5 57.7Nov 66.0 73.2 59.3 40.9 66.4 63.1 63.0 69.7 56.6 34.2 63.6 57.8Dec 66.0 73.1 59.4 41.0 66.3 63.3 62.7 69.3 56.5 34.0 63.4 57.61 Civilian labor force or civilian employment as percent of civilian noninstitutional population in group specified.2 See footnote 1, Table B–37.Note.—Data relate to persons 16 years of age and over.See footnote 5 and Note, Table B–35.Source: Department of Labor (Bureau of Labor Statistics).Appendix B – Population, Employment, Wages, and Productivity | 273
- Page 1 and 2:
EconomicReportof thePresidentTransm
- Page 4 and 5:
C O N T E N T SPageECONOMIC REPORT
- Page 7 and 8:
ECONOMIC REPORT OF THE PRESIDENTTo
- Page 9:
$2 billion to a new international c
- Page 13:
LETTER OF TRANSMITTALCouncil of Eco
- Page 16 and 17:
chapter 3. the causes and consequen
- Page 18 and 19:
appendixesA. Report to the Presiden
- Page 20 and 21:
2-5. Mortgage Lending Today........
- Page 22 and 23:
Chapter 1: The Year in Reviewand th
- Page 24 and 25:
Chapter 3: The Causes and Consequen
- Page 26 and 27:
• Tax reductions in 2001 and 2003
- Page 28 and 29:
• More effective statistical use
- Page 30 and 31:
• Real GDP posted solid 2.5 perce
- Page 32 and 33:
elative to non-energy prices, while
- Page 34 and 35:
nonconforming mortgages in 2007. In
- Page 36 and 37:
In addition to incomes and mortgage
- Page 38 and 39:
Business InventoriesInventory inves
- Page 40 and 41:
Indeed, the growth in foreign econo
- Page 42 and 43:
During the 12 months of 2007, the u
- Page 44 and 45:
output measures announced in the an
- Page 46 and 47:
and government purchases. In contra
- Page 48 and 49:
Table 1-1.—Administration Economi
- Page 50 and 51:
Box 1-3 — continuedParticipation
- Page 52 and 53:
finalized), below its 1963-2006 ave
- Page 55 and 56:
C H A P T E R 2Credit and Housing M
- Page 57 and 58:
lends a debtor money today, which t
- Page 59 and 60:
Box 2-1 — continuedPrime loan: Lo
- Page 61 and 62:
Box 2-2 — continuedNRSROs. Critic
- Page 63 and 64:
Box 2-3 — continuedMortgage defau
- Page 65 and 66:
Box 2-3 — continuedmortgage defau
- Page 67 and 68:
Corporate bond yields also rose rel
- Page 69 and 70:
conduits in that SIVs have less acc
- Page 71 and 72:
International ImplicationsA notable
- Page 73 and 74:
come together to create a coordinat
- Page 75 and 76:
home is forgiven, that portion is t
- Page 77 and 78:
alternatives offered in the convent
- Page 79 and 80:
to such a change in wealth, which a
- Page 81:
lending. FHA Modernization will enc
- Page 84 and 85:
Economists often call attention to
- Page 86 and 87:
Box 3-1: Trade in ServicesDiscussio
- Page 88 and 89:
Box 3-2: The Current Account Defici
- Page 90 and 91:
Growth in Domestic ProductionA seco
- Page 92 and 93:
Exports and Foreign Direct Investme
- Page 94 and 95:
in CFIUS’s role in protecting nat
- Page 96 and 97:
these goods than if they were produ
- Page 98 and 99:
y import competition are electrical
- Page 101 and 102:
C H A P T E R 4The Importance of He
- Page 103 and 104:
Box 4-1: Health Effects on Job Prod
- Page 105 and 106:
health care spending growth. Rising
- Page 107 and 108:
While the study focused on spending
- Page 109 and 110:
Box 4-2 — continuedand without pr
- Page 111 and 112:
effective price of zero. Even if a
- Page 113 and 114:
deduction for health insurance to a
- Page 115 and 116:
To reduce the extent to which high-
- Page 117 and 118:
Administration supports broad adopt
- Page 119 and 120:
C H A P T E R 5Tax PolicySocieties
- Page 121 and 122:
in 2000. Tax revenues increased str
- Page 123 and 124:
Alternative Minimum TaxPrior to 196
- Page 125 and 126:
The Impact of Recent Tax Reductions
- Page 127 and 128:
35 percent marginal tax rate on the
- Page 129 and 130:
C corporations fall under the corpo
- Page 131 and 132:
Significance of Tax Cuts to Individ
- Page 133 and 134:
Box 5-1: Marriage Penalty BasicsIt
- Page 135 and 136:
The Structure of Business TaxesDesp
- Page 137 and 138:
investments are made. A more modest
- Page 139 and 140:
able to defer $35 of tax liability
- Page 141 and 142:
C H A P T E R 6The Nation’s Infra
- Page 143 and 144:
A monopolistic bridge owner may cho
- Page 145 and 146:
etween places to accommodating grow
- Page 147 and 148:
the same time. At hours when many d
- Page 149 and 150:
BridgesOn August 1, 2007, the I-35W
- Page 151 and 152:
where shippers have an alternative
- Page 153 and 154:
Freight shipments into and out of t
- Page 155 and 156:
Box 6-2: Delays at New York City Ai
- Page 157 and 158:
uilt, the marginal cost of transmis
- Page 159 and 160:
access was in mobile wireless conne
- Page 161 and 162:
Infrastructure PolicyThough the U.S
- Page 163 and 164:
could shorten the wait by adding an
- Page 165 and 166:
In 2005, the Federal Aviation Admin
- Page 167 and 168:
C H A P T E R 7Searching for Altern
- Page 169 and 170:
The first U.S. oil well was drilled
- Page 171 and 172:
Most of the oil consumed in the Uni
- Page 173 and 174:
Also, depending on the fuel and tec
- Page 175 and 176:
Table 7-1. —Estimated Average Lev
- Page 177 and 178:
Nevada. The facility is expected to
- Page 179 and 180:
Wind PowerWind power supplies about
- Page 181 and 182:
amounts of electricity, it could be
- Page 183 and 184:
years, as corn-based ethanol produc
- Page 185 and 186:
the power, range, and convenient fu
- Page 187 and 188:
other petroleum products is project
- Page 189 and 190:
To help meet the growing demand for
- Page 191 and 192:
C H A P T E R 8Improving Economic S
- Page 193 and 194:
The second largest Federal statisti
- Page 195 and 196:
As shown in Chart 8-3, spending on
- Page 197 and 198:
Monetary and fiscal policymakers al
- Page 199 and 200:
service-sector output much more fre
- Page 201 and 202:
Box 8-1: How to Reverse a Decline i
- Page 203 and 204:
Information Protection and Statisti
- Page 205 and 206:
forward instead of the growth rate
- Page 207:
Appendix AREPORT TO THE PRESIDENT O
- Page 210 and 211:
Council Members and Their Dates of
- Page 213 and 214:
Report to the President on theActiv
- Page 215 and 216:
The Council also prepared in-depth
- Page 217 and 218:
The Staff of the Council of Economi
- Page 219:
Jane Tufts, Bruce Kaplan, and Anna
- Page 223 and 224:
C O N T E N T SNational Income or E
- Page 225 and 226: Prices—ContinuedPageB-63. Changes
- Page 227 and 228: General NotesDetail in these tables
- Page 229 and 230: Table B-1.—Gross domestic product
- Page 231 and 232: Table B-2.—Real gross domestic pr
- Page 233 and 234: Table B-4.—Percent changes in rea
- Page 235 and 236: Table B-5.—Contributions to perce
- Page 237 and 238: Table B-6.—Chain-type quantity in
- Page 239 and 240: Table B-7.—Chain-type price index
- Page 241 and 242: Table B-9.—Real gross domestic pr
- Page 243 and 244: Table B-11.—Real gross value adde
- Page 245 and 246: Table B-12.—Gross domestic produc
- Page 247 and 248: Table B-13.—Real gross domestic p
- Page 249 and 250: Table B-15.—Gross value added and
- Page 251 and 252: Table B-17.—Real personal consump
- Page 253 and 254: Table B-19.—Real private fixed in
- Page 255 and 256: Table B-21.—Real government consu
- Page 257 and 258: QuarterTable B-23.—Real private i
- Page 259 and 260: Table B-25.—Real exports and impo
- Page 261 and 262: Table B-27.—Relation of national
- Page 263 and 264: Table B-28.—National income by ty
- Page 265 and 266: Table B-29.—Sources of personal i
- Page 267 and 268: Table B-31.—Total and per capita
- Page 269 and 270: Table B-32.—Gross saving and inve
- Page 271 and 272: Population, Employment, Wages, and
- Page 273 and 274: Table B-35.—Civilian population a
- Page 275: Table B-37.—Civilian employment b
- Page 279 and 280: Table B-41.—Civilian employment/p
- Page 281 and 282: Table B-43.—Civilian unemployment
- Page 283 and 284: Table B-45.—Unemployment insuranc
- Page 285 and 286: Table B-46.—Employees on nonagric
- Page 287 and 288: Table B-48.—Employment cost index
- Page 289 and 290: Table B-50.—Changes in productivi
- Page 291 and 292: Table B-52.—Industrial production
- Page 293 and 294: Table B-54.—Capacity utilization
- Page 295 and 296: Table B-56.—New private housing u
- Page 297 and 298: Table B-58.—Manufacturers’ ship
- Page 299 and 300: PricesTable B-60.—Consumer price
- Page 301 and 302: Table B-61.—Consumer price indexe
- Page 303 and 304: Table B-63.—Changes in special co
- Page 305 and 306: Year or monthTable B-65.—Producer
- Page 307 and 308: Table B-66.—Producer price indexe
- Page 309 and 310: Table B-67.—Producer price indexe
- Page 311 and 312: Year and monthMoney Stock, Credit,
- Page 313 and 314: Table B-70.—Components of money s
- Page 315 and 316: Table B-72.—Bank credit at all co
- Page 317 and 318: Table B-73.—Bond yields and inter
- Page 319 and 320: Table B-74.—Credit market borrowi
- Page 321 and 322: Table B-76.—Mortgage debt outstan
- Page 323 and 324: Government FinanceTable B-78.—Fed
- Page 325 and 326: Table B-80.—Federal receipts and
- Page 327 and 328:
Table B-82.—Federal and State and
- Page 329 and 330:
Table B-84.—Federal Government cu
- Page 331 and 332:
Table B-86.—State and local gover
- Page 333 and 334:
Table B-88.—Maturity distribution
- Page 335 and 336:
Corporate Profits and FinanceTable
- Page 337 and 338:
Table B-92.—Corporate profits of
- Page 339 and 340:
Table B-94.—Relation of profits a
- Page 341 and 342:
Year or monthTable B-96.—Common s
- Page 343 and 344:
Table B-98.—Farm business balance
- Page 345 and 346:
YearTotalTable B-100.—Farm input
- Page 347 and 348:
Table B-102.—U.S. exports and imp
- Page 349 and 350:
Table B-103.—U.S. international t
- Page 351 and 352:
Table B-105.—U.S. international t
- Page 353 and 354:
Table B-107.—International invest
- Page 355 and 356:
Table B-109.—Civilian unemploymen
- Page 357 and 358:
Table B-111.—International reserv