

President
ERP_Cover_Proofs with green barcode.indd - The American ...
ERP_Cover_Proofs with green barcode.indd - The American ...

Create successful ePaper yourself
Turn your PDF publications into a flip-book with our unique Google optimized e-Paper software.
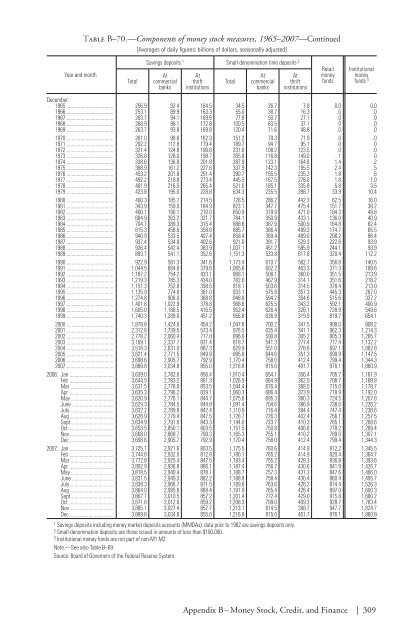
Table B–70.—Components of money stock measures, 1965–2007—Continued[Averages of daily figures; billions of dollars, seasonally adjusted]Year and monthTotalSavings deposits 1 Small-denomination time deposits 2 RetailAtAtAtAt moneycommercial thrift Total commercial thrift fundsbanks institutionsbanks institutionsInstitutionalmoneyfunds 3December:1965 256.9 92.4 164.5 34.5 26.7 7.8 0.0 0.01966 253.1 89.9 163.3 55.0 38.7 16.3 .0 .01967 263.7 94.1 169.6 77.8 50.7 27.1 .0 .01968 268.9 96.1 172.8 100.5 63.5 37.1 .0 .01969 263.7 93.8 169.8 120.4 71.6 48.8 .0 .01970 261.0 98.6 162.3 151.2 79.3 71.9 .0 .01971 292.2 112.8 179.4 189.7 94.7 95.1 .0 .01972 321.4 124.8 196.6 231.6 108.2 123.5 .0 .01973 326.8 128.0 198.7 265.8 116.8 149.0 .1 .01974 338.6 136.8 201.8 287.9 123.1 164.8 1.4 .21975 388.9 161.2 227.6 337.9 142.3 195.5 2.4 .51976 453.2 201.8 251.4 390.7 155.5 235.2 1.8 .61977 492.2 218.8 273.4 445.5 167.5 278.0 1.8 1.01978 481.9 216.5 265.4 521.0 185.1 335.8 5.8 3.51979 423.8 195.0 228.8 634.3 235.5 398.7 33.9 10.41980 400.3 185.7 214.5 728.5 286.2 442.3 62.5 16.01981 343.9 159.0 184.9 823.1 347.7 475.4 151.7 38.21982 400.1 190.1 210.0 850.9 379.9 471.0 184.3 48.81983 684.9 363.2 321.7 784.1 350.9 433.1 136.0 40.91984 704.7 389.3 315.4 888.8 387.9 500.9 164.8 62.41985 815.3 456.6 358.6 885.7 386.4 499.3 174.7 65.51986 940.9 533.5 407.4 858.4 369.4 489.0 208.2 86.41987 937.4 534.8 402.6 921.0 391.7 529.3 222.6 93.91988 926.4 542.4 383.9 1,037.1 451.2 585.9 244.1 93.91989 893.7 541.1 352.6 1,151.3 533.8 617.6 320.4 112.21990 922.9 581.3 341.6 1,173.4 610.7 562.7 356.8 140.51991 1,044.5 664.8 379.6 1,065.6 602.2 463.3 371.3 189.61992 1,187.2 754.2 433.1 868.1 508.1 360.0 351.5 213.91993 1,219.3 785.3 434.0 782.0 467.9 314.1 351.6 218.21994 1,151.3 752.8 398.5 818.1 503.6 314.5 378.4 213.01995 1,135.9 774.8 361.0 933.1 575.8 357.3 445.3 267.01996 1,274.8 906.0 368.8 948.8 594.2 354.6 515.6 327.21997 1,401.8 1,022.9 378.8 968.6 625.5 343.2 592.1 400.91998 1,605.0 1,188.5 416.5 952.4 626.4 326.1 728.9 549.61999 1,740.3 1,289.0 451.2 956.8 636.9 319.9 819.7 654.12000 1,878.8 1,424.6 454.2 1,047.6 700.2 347.5 908.0 808.22001 2,312.8 1,739.5 573.4 976.5 635.4 341.1 962.3 1,214.32002 2,778.2 2,060.4 717.8 896.0 590.8 305.2 885.3 1,265.72003 3,169.1 2,337.7 831.4 818.7 541.3 277.4 777.4 1,132.22004 3,518.3 2,631.0 887.3 829.9 551.0 278.8 697.1 1,082.82005 3,621.4 2,771.5 849.9 995.8 644.6 351.3 699.9 1,147.52006 3,698.6 2,905.7 792.9 1,170.4 758.0 412.4 799.4 1,344.32007 3,889.8 3,034.8 855.0 1,216.8 815.0 401.7 976.1 1,860.92006: Jan 3,639.0 2,782.6 856.4 1,010.4 654.1 356.4 705.7 1,161.9Feb 3,644.5 2,783.2 861.3 1,026.9 664.9 362.0 708.7 1,168.8Mar 3,631.5 2,778.0 853.5 1,044.4 676.4 368.0 715.0 1,178.7Apr 3,635.3 2,796.2 839.1 1,060.3 686.4 373.9 718.9 1,192.0May 3,620.9 2,776.1 844.7 1,075.6 695.3 380.3 724.5 1,207.8June 3,629.3 2,784.5 844.8 1,091.4 704.6 386.9 738.0 1,226.2July 3,632.2 2,789.8 842.4 1,110.9 716.4 394.4 747.4 1,238.6Aug 3,626.9 2,779.4 847.5 1,128.7 726.3 402.4 756.1 1,257.5Sept 3,634.9 2,791.6 843.3 1,144.0 733.7 410.3 765.1 1,268.6Oct 3,653.5 2,850.1 803.5 1,157.5 750.8 406.8 778.2 1,289.4Nov 3,668.0 2,868.7 799.3 1,165.3 755.1 410.2 789.0 1,307.1Dec 3,698.6 2,905.7 792.9 1,170.4 758.0 412.4 799.4 1,344.32007: Jan 3,725.1 2,921.6 803.5 1,175.5 760.6 414.8 812.2 1,345.5Feb 3,744.8 2,932.0 812.8 1,180.1 765.2 414.9 820.4 1,364.7Mar 3,772.8 2,925.4 847.5 1,183.4 755.2 428.3 836.8 1,393.6Apr 3,802.9 2,936.8 866.1 1,187.4 756.7 430.6 841.9 1,426.7May 3,818.5 2,940.4 878.1 1,188.7 757.3 431.3 847.6 1,466.0June 3,831.5 2,949.3 882.2 1,188.8 758.4 430.4 860.4 1,495.7July 3,838.3 2,966.7 871.5 1,189.8 763.6 426.2 874.4 1,526.3Aug 3,864.0 2,995.6 868.4 1,191.9 765.4 426.4 897.0 1,600.3Sept 3,867.7 3,010.5 857.2 1,201.4 772.4 429.0 915.8 1,680.2Oct 3,871.8 3,012.6 859.2 1,208.3 799.0 409.3 928.7 1,763.4Nov 3,885.1 3,027.4 857.7 1,213.1 814.5 398.7 947.7 1,824.7Dec 3,889.8 3,034.8 855.0 1,216.8 815.0 401.7 976.1 1,860.91 Savings deposits including money market deposits accounts (MMDAs); data prior to 1982 are savings deposits only.2 Small-denomination deposits are those issued in amounts of less than $100,000.3 Institutional money funds are not part of non-M1 M2.Note.—See also Table B–69.Source: Board of Governors of the Federal Reserve System.Appendix B – Money Stock, Credit, and Finance | 309


