Table B–46.—Employees on nonagricultural payrolls, by major industry, 1960–2007[Thousands of persons; monthly data seasonally adjusted]Goods-producing industriesService-providing industriesYear or monthTotalTotalNaturalresourcesandminingConstructionTotalManufacturingDurablegoodsNondurablegoodsTotalTrade, transportation,and utilities 1TotalRetail trade1960 54,296 19,182 771 2,973 15,438 9,071 6,367 35,114 11,147 5,5891961 54,105 18,647 728 2,908 15,011 8,711 6,300 35,458 11,040 5,5601962 55,659 19,203 709 2,997 15,498 9,099 6,399 36,455 11,215 5,6721963 56,764 19,385 694 3,060 15,631 9,226 6,405 37,379 11,367 5,7811964 58,391 19,733 697 3,148 15,888 9,414 6,474 38,658 11,677 5,9771965 60,874 20,595 694 3,284 16,617 9,973 6,644 40,279 12,139 6,2621966 64,020 21,740 690 3,371 17,680 10,803 6,878 42,280 12,611 6,5301967 65,931 21,882 679 3,305 17,897 10,952 6,945 44,049 12,950 6,7111968 68,023 22,292 671 3,410 18,211 11,137 7,074 45,731 13,334 6,9771969 70,512 22,893 683 3,637 18,573 11,396 7,177 47,619 13,853 7,2951970 71,006 22,179 677 3,654 17,848 10,762 7,086 48,827 14,144 7,4631971 71,335 21,602 658 3,770 17,174 10,229 6,944 49,734 14,318 7,6571972 73,798 22,299 672 3,957 17,669 10,630 7,039 51,499 14,788 8,0381973 76,912 23,450 693 4,167 18,589 11,414 7,176 53,462 15,349 8,3711974 78,389 23,364 755 4,095 18,514 11,432 7,082 55,025 15,693 8,5361975 77,069 21,318 802 3,608 16,909 10,266 6,643 55,751 15,606 8,6001976 79,502 22,025 832 3,662 17,531 10,640 6,891 57,477 16,128 8,9661977 82,593 22,972 865 3,940 18,167 11,132 7,035 59,620 16,765 9,3591978 86,826 24,156 902 4,322 18,932 11,770 7,162 62,670 17,658 9,8791979 89,932 24,997 1,008 4,562 19,426 12,220 7,206 64,935 18,303 10,1801980 90,528 24,263 1,077 4,454 18,733 11,679 7,054 66,265 18,413 10,2441981 91,289 24,118 1,180 4,304 18,634 11,611 7,023 67,172 18,604 10,3641982 89,677 22,550 1,163 4,024 17,363 10,610 6,753 67,127 18,457 10,3721983 90,280 22,110 997 4,065 17,048 10,326 6,722 68,171 18,668 10,6351984 94,530 23,435 1,014 4,501 17,920 11,050 6,870 71,095 19,653 11,2231985 97,511 23,585 974 4,793 17,819 11,034 6,784 73,926 20,379 11,7331986 99,474 23,318 829 4,937 17,552 10,795 6,757 76,156 20,795 12,0781987 102,088 23,470 771 5,090 17,609 10,767 6,842 78,618 21,302 12,4191988 105,345 23,909 770 5,233 17,906 10,969 6,938 81,436 21,974 12,8081989 108,014 24,045 750 5,309 17,985 11,004 6,981 83,969 22,510 13,1081990 109,487 23,723 765 5,263 17,695 10,736 6,959 85,764 22,666 13,1821991 108,374 22,588 739 4,780 17,068 10,219 6,849 85,787 22,281 12,8961992 108,726 22,095 689 4,608 16,799 9,945 6,854 86,631 22,125 12,8281993 110,844 22,219 666 4,779 16,774 9,900 6,873 88,625 22,378 13,0211994 114,291 22,774 659 5,095 17,021 10,131 6,890 91,517 23,128 13,4911995 117,298 23,156 641 5,274 17,241 10,372 6,869 94,142 23,834 13,8971996 119,708 23,410 637 5,536 17,237 10,485 6,752 96,299 24,239 14,1431997 122,776 23,886 654 5,813 17,419 10,704 6,716 98,890 24,700 14,3891998 125,930 24,354 645 6,149 17,560 10,910 6,650 101,576 25,186 14,6091999 128,993 24,465 598 6,545 17,322 10,830 6,492 104,528 25,771 14,9702000 131,785 24,649 599 6,787 17,263 10,876 6,388 107,136 26,225 15,2802001 131,826 23,873 606 6,826 16,441 10,335 6,107 107,952 25,983 15,2392002 130,341 22,557 583 6,716 15,259 9,483 5,775 107,784 25,497 15,0252003 129,999 21,816 572 6,735 14,510 8,963 5,547 108,182 25,287 14,9172004 131,435 21,882 591 6,976 14,315 8,924 5,391 109,553 25,533 15,0582005 133,703 22,190 628 7,336 14,226 8,955 5,272 111,513 25,959 15,2802006 136,174 22,570 684 7,689 14,197 9,001 5,197 113,605 26,231 15,3192007 p 137,969 22,378 722 7,624 14,032 8,890 5,141 115,591 26,472 15,3822006: Jan 135,110 22,489 655 7,615 14,219 8,984 5,235 112,621 26,157 15,346Feb 135,410 22,541 661 7,668 14,212 8,986 5,226 112,869 26,187 15,354Mar 135,659 22,573 669 7,692 14,212 8,999 5,213 113,086 26,225 15,378Apr 135,803 22,604 678 7,699 14,227 9,020 5,207 113,199 26,207 15,337May 135,906 22,593 680 7,698 14,215 9,016 5,199 113,313 26,194 15,303June 136,030 22,613 684 7,691 14,238 9,034 5,204 113,417 26,197 15,296July 136,252 22,622 690 7,703 14,229 9,023 5,206 113,630 26,226 15,306Aug 136,438 22,629 692 7,719 14,218 9,021 5,197 113,809 26,227 15,298Sept 136,636 22,625 694 7,725 14,206 9,017 5,189 114,011 26,241 15,290Oct 136,745 22,573 700 7,707 14,166 8,996 5,170 114,172 26,258 15,298Nov 136,941 22,525 699 7,683 14,143 8,972 5,171 114,416 26,320 15,328Dec 137,167 22,520 705 7,684 14,131 8,972 5,159 114,647 26,345 15,3242007: Jan 137,329 22,554 706 7,718 14,130 8,952 5,178 114,775 26,378 15,358Feb 137,419 22,465 711 7,641 14,113 8,943 5,170 114,954 26,393 15,365Mar 137,594 22,497 715 7,692 14,090 8,928 5,162 115,097 26,436 15,404Apr 137,716 22,460 717 7,671 14,072 8,921 5,151 115,256 26,427 15,377May 137,904 22,446 718 7,659 14,069 8,913 5,156 115,458 26,459 15,395June 137,973 22,436 721 7,665 14,050 8,897 5,153 115,537 26,465 15,383July 138,066 22,421 726 7,649 14,046 8,900 5,146 115,645 26,489 15,390Aug 138,159 22,349 728 7,620 14,001 8,873 5,128 115,810 26,494 15,386Sept 138,203 22,309 728 7,595 13,986 8,862 5,124 115,894 26,518 15,383Oct 138,362 22,266 728 7,575 13,963 8,845 5,118 116,096 26,510 15,363Nov p 138,477 22,221 733 7,538 13,950 8,843 5,107 116,256 26,554 15,395Dec p 138,495 22,146 738 7,489 13,919 8,823 5,096 116,349 26,526 15,3701 Includes wholesale trade, transportation and warehousing, and utilities, not shown separately.Note.—Data in Tables B–46 and B–47 are based on reports from employing establishments and relate to full- and part-time wage and salary workers innonagricultural establishments who received pay for any part of the pay period that includes the 12th of the month. Not comparable with labor force data(Tables B–35 through B–44), which include proprietors, self-employed persons, unpaid family workers, and private household workers; which count persons asemployed when they are not at work because of industrial disputes, bad weather, etc., even if they are not paid for the time off; which are based on aSee next page for continuation of table.280 | Economic Report of the <strong>President</strong>
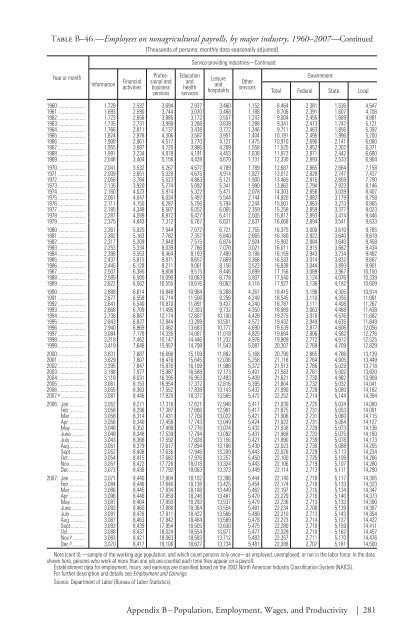
Table B–46.—Employees on nonagricultural payrolls, by major industry, 1960–2007—Continued[Thousands of persons; monthly data seasonally adjusted]Service-providing industries—ContinuedYear or monthInformationFinancialactivitiesProfessionalandbusinessservicesEducationandhealthservicesLeisureandhospitalityOtherservicesGovernmentTotal Federal State Local1960 1,728 2,532 3,694 2,937 3,460 1,152 8,464 2,381 1,536 4,5471961 1,693 2,590 3,744 3,030 3,468 1,188 8,706 2,391 1,607 4,7081962 1,723 2,656 3,885 3,172 3,557 1,243 9,004 2,455 1,669 4,8811963 1,735 2,731 3,990 3,288 3,639 1,288 9,341 2,473 1,747 5,1211964 1,766 2,811 4,137 3,438 3,772 1,346 9,711 2,463 1,856 5,3921965 1,824 2,878 4,306 3,587 3,951 1,404 10,191 2,495 1,996 5,7001966 1,908 2,961 4,517 3,770 4,127 1,475 10,910 2,690 2,141 6,0801967 1,955 3,087 4,720 3,986 4,269 1,558 11,525 2,852 2,302 6,3711968 1,991 3,234 4,918 4,191 4,453 1,638 11,972 2,871 2,442 6,6601969 2,048 3,404 5,156 4,428 4,670 1,731 12,330 2,893 2,533 6,9041970 2,041 3,532 5,267 4,577 4,789 1,789 12,687 2,865 2,664 7,1581971 2,009 3,651 5,328 4,675 4,914 1,827 13,012 2,828 2,747 7,4371972 2,056 3,784 5,523 4,863 5,121 1,900 13,465 2,815 2,859 7,7901973 2,135 3,920 5,774 5,092 5,341 1,990 13,862 2,794 2,923 8,1461974 2,160 4,023 5,974 5,322 5,471 2,078 14,303 2,858 3,039 8,4071975 2,061 4,047 6,034 5,497 5,544 2,144 14,820 2,882 3,179 8,7581976 2,111 4,155 6,287 5,756 5,794 2,244 15,001 2,863 3,273 8,8651977 2,185 4,348 6,587 6,052 6,065 2,359 15,258 2,859 3,377 9,0231978 2,287 4,599 6,972 6,427 6,411 2,505 15,812 2,893 3,474 9,4461979 2,375 4,843 7,312 6,767 6,631 2,637 16,068 2,894 3,541 9,6331980 2,361 5,025 7,544 7,072 6,721 2,755 16,375 3,000 3,610 9,7651981 2,382 5,163 7,782 7,357 6,840 2,865 16,180 2,922 3,640 9,6191982 2,317 5,209 7,848 7,515 6,874 2,924 15,982 2,884 3,640 9,4581983 2,253 5,334 8,039 7,766 7,078 3,021 16,011 2,915 3,662 9,4341984 2,398 5,553 8,464 8,193 7,489 3,186 16,159 2,943 3,734 9,4821985 2,437 5,815 8,871 8,657 7,869 3,366 16,533 3,014 3,832 9,6871986 2,445 6,128 9,211 9,061 8,156 3,523 16,838 3,044 3,893 9,9011987 2,507 6,385 9,608 9,515 8,446 3,699 17,156 3,089 3,967 10,1001988 2,585 6,500 10,090 10,063 8,778 3,907 17,540 3,124 4,076 10,3391989 2,622 6,562 10,555 10,616 9,062 4,116 17,927 3,136 4,182 10,6091990 2,688 6,614 10,848 10,984 9,288 4,261 18,415 3,196 4,305 10,9141991 2,677 6,558 10,714 11,506 9,256 4,249 18,545 3,110 4,355 11,0811992 2,641 6,540 10,970 11,891 9,437 4,240 18,787 3,111 4,408 11,2671993 2,668 6,709 11,495 12,303 9,732 4,350 18,989 3,063 4,488 11,4381994 2,738 6,867 12,174 12,807 10,100 4,428 19,275 3,018 4,576 11,6821995 2,843 6,827 12,844 13,289 10,501 4,572 19,432 2,949 4,635 11,8491996 2,940 6,969 13,462 13,683 10,777 4,690 19,539 2,877 4,606 12,0561997 3,084 7,178 14,335 14,087 11,018 4,825 19,664 2,806 4,582 12,2761998 3,218 7,462 15,147 14,446 11,232 4,976 19,909 2,772 4,612 12,5251999 3,419 7,648 15,957 14,798 11,543 5,087 20,307 2,769 4,709 12,8292000 3,631 7,687 16,666 15,109 11,862 5,168 20,790 2,865 4,786 13,1392001 3,629 7,807 16,476 15,645 12,036 5,258 21,118 2,764 4,905 13,4492002 3,395 7,847 15,976 16,199 11,986 5,372 21,513 2,766 5,029 13,7182003 3,188 7,977 15,987 16,588 12,173 5,401 21,583 2,761 5,002 13,8202004 3,118 8,031 16,395 16,953 12,493 5,409 21,621 2,730 4,982 13,9092005 3,061 8,153 16,954 17,372 12,816 5,395 21,804 2,732 5,032 14,0412006 3,055 8,363 17,552 17,838 13,143 5,432 21,990 2,728 5,080 14,1822007 p 3,087 8,446 17,920 18,377 13,565 5,472 22,252 2,714 5,144 14,3942006: Jan 3,052 8,271 17,316 17,621 12,948 5,417 21,839 2,725 5,034 14,080Feb 3,058 8,298 17,387 17,666 12,981 5,417 21,875 2,731 5,053 14,091Mar 3,058 8,314 17,431 17,709 13,022 5,421 21,906 2,731 5,060 14,115Apr 3,056 8,340 17,458 17,743 13,049 5,424 21,922 2,731 5,064 14,127May 3,048 8,352 17,499 17,776 13,074 5,432 21,938 2,729 5,073 14,136June 3,048 8,348 17,539 17,794 13,092 5,431 21,968 2,733 5,075 14,160July 3,043 8,368 17,592 17,828 13,156 5,427 21,990 2,739 5,078 14,173Aug 3,051 8,379 17,617 17,894 13,188 5,430 22,023 2,730 5,088 14,205Sept 3,052 8,408 17,636 17,946 13,209 5,443 22,076 2,729 5,113 14,234Oct 3,054 8,415 17,662 17,976 13,257 5,450 22,100 2,725 5,109 14,266Nov 3,057 8,422 17,726 18,018 13,324 5,443 22,106 2,719 5,107 14,280Dec 3,073 8,438 17,792 18,063 13,373 5,449 22,114 2,713 5,111 14,2902007: Jan 3,071 8,440 17,804 18,102 13,396 5,444 22,140 2,718 5,117 14,305Feb 3,084 8,446 17,840 18,138 13,425 5,454 22,174 2,718 5,133 14,323Mar 3,086 8,445 17,834 18,188 13,449 5,462 22,197 2,716 5,134 14,347Apr 3,096 8,448 17,859 18,246 13,481 5,470 22,229 2,716 5,140 14,373May 3,097 8,464 17,893 18,293 13,537 5,479 22,236 2,713 5,133 14,390June 3,093 8,460 17,886 18,364 13,554 5,481 22,234 2,708 5,139 14,387July 3,091 8,476 17,911 18,422 13,566 5,480 22,210 2,713 5,143 14,354Aug 3,087 8,463 17,942 18,484 13,589 5,478 22,273 2,714 5,137 14,422Sept 3,093 8,439 17,954 18,505 13,630 5,475 22,280 2,710 5,159 14,411Oct 3,088 8,437 18,024 18,554 13,677 5,477 22,329 2,710 5,162 14,457Nov p 3,083 8,421 18,063 18,583 13,712 5,483 22,357 2,711 5,170 14,476Dec p 3,070 8,417 18,106 18,627 13,734 5,481 22,388 2,707 5,181 14,500Note (cont’d).—sample of the working-age population; and which count persons only once—as employed, unemployed, or not in the labor force. In the datashown here, persons who work at more than one job are counted each time they appear on a payroll.Establishment data for employment, hours, and earnings are classified based on the 2002 North American Industry Classification System (NAICS).For further description and details see Employment and Earnings.Source: Department of Labor (Bureau of Labor Statistics).Appendix B – Population, Employment, Wages, and Productivity | 281
- Page 1 and 2:
EconomicReportof thePresidentTransm
- Page 4 and 5:
C O N T E N T SPageECONOMIC REPORT
- Page 7 and 8:
ECONOMIC REPORT OF THE PRESIDENTTo
- Page 9:
$2 billion to a new international c
- Page 13:
LETTER OF TRANSMITTALCouncil of Eco
- Page 16 and 17:
chapter 3. the causes and consequen
- Page 18 and 19:
appendixesA. Report to the Presiden
- Page 20 and 21:
2-5. Mortgage Lending Today........
- Page 22 and 23:
Chapter 1: The Year in Reviewand th
- Page 24 and 25:
Chapter 3: The Causes and Consequen
- Page 26 and 27:
• Tax reductions in 2001 and 2003
- Page 28 and 29:
• More effective statistical use
- Page 30 and 31:
• Real GDP posted solid 2.5 perce
- Page 32 and 33:
elative to non-energy prices, while
- Page 34 and 35:
nonconforming mortgages in 2007. In
- Page 36 and 37:
In addition to incomes and mortgage
- Page 38 and 39:
Business InventoriesInventory inves
- Page 40 and 41:
Indeed, the growth in foreign econo
- Page 42 and 43:
During the 12 months of 2007, the u
- Page 44 and 45:
output measures announced in the an
- Page 46 and 47:
and government purchases. In contra
- Page 48 and 49:
Table 1-1.—Administration Economi
- Page 50 and 51:
Box 1-3 — continuedParticipation
- Page 52 and 53:
finalized), below its 1963-2006 ave
- Page 55 and 56:
C H A P T E R 2Credit and Housing M
- Page 57 and 58:
lends a debtor money today, which t
- Page 59 and 60:
Box 2-1 — continuedPrime loan: Lo
- Page 61 and 62:
Box 2-2 — continuedNRSROs. Critic
- Page 63 and 64:
Box 2-3 — continuedMortgage defau
- Page 65 and 66:
Box 2-3 — continuedmortgage defau
- Page 67 and 68:
Corporate bond yields also rose rel
- Page 69 and 70:
conduits in that SIVs have less acc
- Page 71 and 72:
International ImplicationsA notable
- Page 73 and 74:
come together to create a coordinat
- Page 75 and 76:
home is forgiven, that portion is t
- Page 77 and 78:
alternatives offered in the convent
- Page 79 and 80:
to such a change in wealth, which a
- Page 81:
lending. FHA Modernization will enc
- Page 84 and 85:
Economists often call attention to
- Page 86 and 87:
Box 3-1: Trade in ServicesDiscussio
- Page 88 and 89:
Box 3-2: The Current Account Defici
- Page 90 and 91:
Growth in Domestic ProductionA seco
- Page 92 and 93:
Exports and Foreign Direct Investme
- Page 94 and 95:
in CFIUS’s role in protecting nat
- Page 96 and 97:
these goods than if they were produ
- Page 98 and 99:
y import competition are electrical
- Page 101 and 102:
C H A P T E R 4The Importance of He
- Page 103 and 104:
Box 4-1: Health Effects on Job Prod
- Page 105 and 106:
health care spending growth. Rising
- Page 107 and 108:
While the study focused on spending
- Page 109 and 110:
Box 4-2 — continuedand without pr
- Page 111 and 112:
effective price of zero. Even if a
- Page 113 and 114:
deduction for health insurance to a
- Page 115 and 116:
To reduce the extent to which high-
- Page 117 and 118:
Administration supports broad adopt
- Page 119 and 120:
C H A P T E R 5Tax PolicySocieties
- Page 121 and 122:
in 2000. Tax revenues increased str
- Page 123 and 124:
Alternative Minimum TaxPrior to 196
- Page 125 and 126:
The Impact of Recent Tax Reductions
- Page 127 and 128:
35 percent marginal tax rate on the
- Page 129 and 130:
C corporations fall under the corpo
- Page 131 and 132:
Significance of Tax Cuts to Individ
- Page 133 and 134:
Box 5-1: Marriage Penalty BasicsIt
- Page 135 and 136:
The Structure of Business TaxesDesp
- Page 137 and 138:
investments are made. A more modest
- Page 139 and 140:
able to defer $35 of tax liability
- Page 141 and 142:
C H A P T E R 6The Nation’s Infra
- Page 143 and 144:
A monopolistic bridge owner may cho
- Page 145 and 146:
etween places to accommodating grow
- Page 147 and 148:
the same time. At hours when many d
- Page 149 and 150:
BridgesOn August 1, 2007, the I-35W
- Page 151 and 152:
where shippers have an alternative
- Page 153 and 154:
Freight shipments into and out of t
- Page 155 and 156:
Box 6-2: Delays at New York City Ai
- Page 157 and 158:
uilt, the marginal cost of transmis
- Page 159 and 160:
access was in mobile wireless conne
- Page 161 and 162:
Infrastructure PolicyThough the U.S
- Page 163 and 164:
could shorten the wait by adding an
- Page 165 and 166:
In 2005, the Federal Aviation Admin
- Page 167 and 168:
C H A P T E R 7Searching for Altern
- Page 169 and 170:
The first U.S. oil well was drilled
- Page 171 and 172:
Most of the oil consumed in the Uni
- Page 173 and 174:
Also, depending on the fuel and tec
- Page 175 and 176:
Table 7-1. —Estimated Average Lev
- Page 177 and 178:
Nevada. The facility is expected to
- Page 179 and 180:
Wind PowerWind power supplies about
- Page 181 and 182:
amounts of electricity, it could be
- Page 183 and 184:
years, as corn-based ethanol produc
- Page 185 and 186:
the power, range, and convenient fu
- Page 187 and 188:
other petroleum products is project
- Page 189 and 190:
To help meet the growing demand for
- Page 191 and 192:
C H A P T E R 8Improving Economic S
- Page 193 and 194:
The second largest Federal statisti
- Page 195 and 196:
As shown in Chart 8-3, spending on
- Page 197 and 198:
Monetary and fiscal policymakers al
- Page 199 and 200:
service-sector output much more fre
- Page 201 and 202:
Box 8-1: How to Reverse a Decline i
- Page 203 and 204:
Information Protection and Statisti
- Page 205 and 206:
forward instead of the growth rate
- Page 207:
Appendix AREPORT TO THE PRESIDENT O
- Page 210 and 211:
Council Members and Their Dates of
- Page 213 and 214:
Report to the President on theActiv
- Page 215 and 216:
The Council also prepared in-depth
- Page 217 and 218:
The Staff of the Council of Economi
- Page 219:
Jane Tufts, Bruce Kaplan, and Anna
- Page 223 and 224:
C O N T E N T SNational Income or E
- Page 225 and 226:
Prices—ContinuedPageB-63. Changes
- Page 227 and 228:
General NotesDetail in these tables
- Page 229 and 230:
Table B-1.—Gross domestic product
- Page 231 and 232:
Table B-2.—Real gross domestic pr
- Page 233 and 234: Table B-4.—Percent changes in rea
- Page 235 and 236: Table B-5.—Contributions to perce
- Page 237 and 238: Table B-6.—Chain-type quantity in
- Page 239 and 240: Table B-7.—Chain-type price index
- Page 241 and 242: Table B-9.—Real gross domestic pr
- Page 243 and 244: Table B-11.—Real gross value adde
- Page 245 and 246: Table B-12.—Gross domestic produc
- Page 247 and 248: Table B-13.—Real gross domestic p
- Page 249 and 250: Table B-15.—Gross value added and
- Page 251 and 252: Table B-17.—Real personal consump
- Page 253 and 254: Table B-19.—Real private fixed in
- Page 255 and 256: Table B-21.—Real government consu
- Page 257 and 258: QuarterTable B-23.—Real private i
- Page 259 and 260: Table B-25.—Real exports and impo
- Page 261 and 262: Table B-27.—Relation of national
- Page 263 and 264: Table B-28.—National income by ty
- Page 265 and 266: Table B-29.—Sources of personal i
- Page 267 and 268: Table B-31.—Total and per capita
- Page 269 and 270: Table B-32.—Gross saving and inve
- Page 271 and 272: Population, Employment, Wages, and
- Page 273 and 274: Table B-35.—Civilian population a
- Page 275 and 276: Table B-37.—Civilian employment b
- Page 277 and 278: Table B-39.—Civilian labor force
- Page 279 and 280: Table B-41.—Civilian employment/p
- Page 281 and 282: Table B-43.—Civilian unemployment
- Page 283: Table B-45.—Unemployment insuranc
- Page 287 and 288: Table B-48.—Employment cost index
- Page 289 and 290: Table B-50.—Changes in productivi
- Page 291 and 292: Table B-52.—Industrial production
- Page 293 and 294: Table B-54.—Capacity utilization
- Page 295 and 296: Table B-56.—New private housing u
- Page 297 and 298: Table B-58.—Manufacturers’ ship
- Page 299 and 300: PricesTable B-60.—Consumer price
- Page 301 and 302: Table B-61.—Consumer price indexe
- Page 303 and 304: Table B-63.—Changes in special co
- Page 305 and 306: Year or monthTable B-65.—Producer
- Page 307 and 308: Table B-66.—Producer price indexe
- Page 309 and 310: Table B-67.—Producer price indexe
- Page 311 and 312: Year and monthMoney Stock, Credit,
- Page 313 and 314: Table B-70.—Components of money s
- Page 315 and 316: Table B-72.—Bank credit at all co
- Page 317 and 318: Table B-73.—Bond yields and inter
- Page 319 and 320: Table B-74.—Credit market borrowi
- Page 321 and 322: Table B-76.—Mortgage debt outstan
- Page 323 and 324: Government FinanceTable B-78.—Fed
- Page 325 and 326: Table B-80.—Federal receipts and
- Page 327 and 328: Table B-82.—Federal and State and
- Page 329 and 330: Table B-84.—Federal Government cu
- Page 331 and 332: Table B-86.—State and local gover
- Page 333 and 334: Table B-88.—Maturity distribution
- Page 335 and 336:
Corporate Profits and FinanceTable
- Page 337 and 338:
Table B-92.—Corporate profits of
- Page 339 and 340:
Table B-94.—Relation of profits a
- Page 341 and 342:
Year or monthTable B-96.—Common s
- Page 343 and 344:
Table B-98.—Farm business balance
- Page 345 and 346:
YearTotalTable B-100.—Farm input
- Page 347 and 348:
Table B-102.—U.S. exports and imp
- Page 349 and 350:
Table B-103.—U.S. international t
- Page 351 and 352:
Table B-105.—U.S. international t
- Page 353 and 354:
Table B-107.—International invest
- Page 355 and 356:
Table B-109.—Civilian unemploymen
- Page 357 and 358:
Table B-111.—International reserv