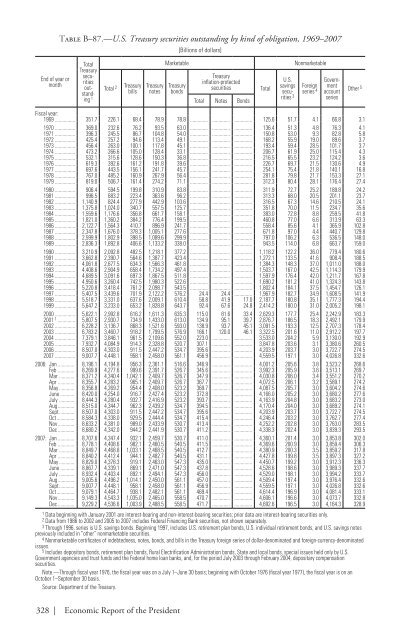
End of year ormonthTable B–87.—U.S. Treasury securities outstanding by kind of obligation, 1969–2007[Billions of dollars]TotalTreasurysecuritiesoutstand-Marketable NonmarketableTreasuryinflation-protectedU.S.Total 2 Treasury Treasury Treasurysecuritiesbills notes bondsTotalsavings Foreignsecuritiesseries 4ing 1 Total Notes Bonds3GovernmentaccountseriesFiscal year:1969 351.7 226.1 68.4 78.9 78.8 125.6 51.7 4.1 66.8 3.11970 369.0 232.6 76.2 93.5 63.0 136.4 51.3 4.8 76.3 4.11971 396.3 245.5 86.7 104.8 54.0 150.8 53.0 9.3 82.8 5.81972 425.4 257.2 94.6 113.4 49.1 168.2 55.9 19.0 89.6 3.71973 456.4 263.0 100.1 117.8 45.1 193.4 59.4 28.5 101.7 3.71974 473.2 266.6 105.0 128.4 33.1 206.7 61.9 25.0 115.4 4.31975 532.1 315.6 128.6 150.3 36.8 216.5 65.5 23.2 124.2 3.61976 619.3 392.6 161.2 191.8 39.6 226.7 69.7 21.5 130.6 4.91977 697.6 443.5 156.1 241.7 45.7 254.1 75.4 21.8 140.1 16.81978 767.0 485.2 160.9 267.9 56.4 281.8 79.8 21.7 153.3 27.11979 819.0 506.7 161.4 274.2 71.1 312.3 80.4 28.1 176.4 27.41980 906.4 594.5 199.8 310.9 83.8 311.9 72.7 25.2 189.8 24.21981 996.5 683.2 223.4 363.6 96.2 313.3 68.0 20.5 201.1 23.71982 1,140.9 824.4 277.9 442.9 103.6 316.5 67.3 14.6 210.5 24.11983 1,375.8 1,024.0 340.7 557.5 125.7 351.8 70.0 11.5 234.7 35.61984 1,559.6 1,176.6 356.8 661.7 158.1 383.0 72.8 8.8 259.5 41.81985 1,821.0 1,360.2 384.2 776.4 199.5 460.8 77.0 6.6 313.9 63.31986 2,122.7 1,564.3 410.7 896.9 241.7 558.4 85.6 4.1 365.9 102.81987 2,347.8 1,676.0 378.3 1,005.1 277.6 671.8 97.0 4.4 440.7 129.81988 2,599.9 1,802.9 398.5 1,089.6 299.9 797.0 106.2 6.3 536.5 148.01989 2,836.3 1,892.8 406.6 1,133.2 338.0 943.5 114.0 6.8 663.7 159.01990 3,210.9 2,092.8 482.5 1,218.1 377.2 1,118.2 122.2 36.0 779.4 180.61991 3,662.8 2,390.7 564.6 1,387.7 423.4 1,272.1 133.5 41.6 908.4 188.51992 4,061.8 2,677.5 634.3 1,566.3 461.8 1,384.3 148.3 37.0 1,011.0 188.01993 4,408.6 2,904.9 658.4 1,734.2 497.4 1,503.7 167.0 42.5 1,114.3 179.91994 4,689.5 3,091.6 697.3 1,867.5 511.8 1,597.9 176.4 42.0 1,211.7 167.81995 4,950.6 3,260.4 742.5 1,980.3 522.6 1,690.2 181.2 41.0 1,324.3 143.81996 5,220.8 3,418.4 761.2 2,098.7 543.5 1,802.4 184.1 37.5 1,454.7 126.11997 5,407.5 3,439.6 701.9 2,122.2 576.2 24.4 24.4 1,967.9 182.7 34.9 1,608.5 141.91998 5,518.7 3,331.0 637.6 2,009.1 610.4 58.8 41.9 17.0 2,187.7 180.8 35.1 1,777.3 194.41999 5,647.2 3,233.0 653.2 1,828.8 643.7 92.4 67.6 24.8 2,414.2 180.0 31.0 2,005.2 198.12000 5,622.1 2,992.8 616.2 1,611.3 635.3 115.0 81.6 33.4 2,629.3 177.7 25.4 2,242.9 183.32001 1 5,807.5 2,930.7 734.9 1,433.0 613.0 134.9 95.1 39.7 2,876.7 186.5 18.3 2,492.1 179.92002 6,228.2 3,136.7 868.3 1,521.6 593.0 138.9 93.7 45.1 3,091.5 193.3 12.5 2,707.3 178.42003 6,783.2 3,460.7 918.2 1,799.5 576.9 166.1 120.0 46.1 3,322.5 201.6 11.0 2,912.2 197.72004 7,379.1 3,846.1 961.5 2,109.6 552.0 223.0 3,533.0 204.2 5.9 3,130.0 192.92005 7,932.7 4,084.9 914.3 2,328.8 520.7 307.1 3,847.8 203.6 3.1 3,380.6 260.52006 8,507.0 4,303.0 911.5 2,447.2 534.7 395.6 4,203.9 203.7 3.0 3,722.7 274.52007 9,007.7 4,448.1 958.1 2,458.0 561.1 456.9 4,559.5 197.1 3.0 4,026.8 332.62006: Jan 8,196.1 4,194.8 956.3 2,361.1 516.6 346.9 4,001.2 205.6 3.8 3,523.2 268.6Feb 8,269.9 4,277.6 999.6 2,391.7 526.7 345.6 3,992.3 205.9 3.6 3,513.1 269.7Mar 8,371.2 4,340.4 1,042.1 2,409.7 526.7 347.9 4,030.8 206.0 3.4 3,551.2 270.2Apr 8,355.7 4,283.2 965.1 2,409.7 526.7 367.7 4,072.5 206.1 3.2 3,589.1 274.2May 8,356.8 4,269.2 954.4 2,408.0 523.2 369.7 4,087.5 205.7 3.0 3,604.2 274.6June 8,420.0 4,254.0 916.7 2,427.4 523.2 372.8 4,166.0 205.2 3.0 3,680.2 277.6July 8,444.3 4,280.4 932.7 2,416.9 523.2 393.7 4,163.9 204.8 3.0 3,683.2 273.0Aug 8,515.0 4,344.7 962.3 2,439.2 534.7 394.5 4,170.4 204.0 3.0 3,689.2 274.1Sept 8,507.0 4,303.0 911.5 2,447.2 534.7 395.6 4,203.9 203.7 3.0 3,722.7 274.5Oct 8,584.3 4,338.0 929.5 2,444.4 534.7 415.4 4,246.4 203.2 3.0 3,762.7 277.4Nov 8,633.2 4,381.0 989.0 2,433.9 530.7 413.4 4,252.2 202.8 3.0 3,763.0 283.5Dec 8,680.2 4,342.0 944.2 2,441.9 530.7 411.2 4,338.3 202.4 3.0 3,839.3 293.52007: Jan 8,707.6 4,347.4 932.1 2,459.7 530.7 411.0 4,360.1 201.4 3.0 3,853.8 302.0Feb 8,778.1 4,408.6 982.1 2,460.5 540.5 411.5 4,369.6 200.9 3.0 3,859.4 306.3Mar 8,849.7 4,468.8 1,033.1 2,468.5 540.5 412.7 4,380.9 200.3 3.5 3,859.2 317.8Apr 8,840.2 4,412.4 944.1 2,482.7 540.5 431.1 4,427.8 199.8 3.5 3,897.3 327.2May 8,829.0 4,378.3 919.1 2,463.0 547.3 435.0 4,450.7 199.2 3.0 3,912.3 336.3June 8,867.7 4,339.1 869.1 2,471.0 547.3 437.8 4,528.6 198.6 3.0 3,989.3 337.7July 8,932.4 4,403.4 892.1 2,494.1 547.3 456.0 4,529.0 198.1 3.0 3,994.2 333.7Aug 9,005.6 4,496.2 1,014.1 2,450.0 561.1 457.0 4,509.4 197.4 3.0 3,976.4 332.6Sept 9,007.7 4,448.1 958.1 2,458.0 561.1 456.9 4,559.5 197.1 3.0 4,026.8 332.6Oct 9,079.1 4,464.7 938.1 2,482.1 561.1 469.4 4,614.4 196.9 3.0 4,081.4 333.1Nov 9,149.3 4,543.3 1,035.0 2,465.0 558.5 470.7 4,606.1 196.6 3.0 4,073.7 332.8Dec 9,229.2 4,536.6 1,003.9 2,488.5 558.5 471.7 4,692.6 196.5 3.0 4,164.3 328.91 Data beginning with January 2001 are interest-bearing and non-interest-bearing securities; prior data are interest-bearing securities only.2 Data from 1986 to 2002 and 2005 to 2007 includes Federal Financing Bank securities, not shown separately.3 Through 1996, series is U.S. savings bonds. Beginning 1997, includes U.S. retirement plan bonds, U.S. individual retirement bonds, and U.S. savings notespreviously included in “other” nonmarketable securities.4 Nonmarketable certificates of indebtedness, notes, bonds, and bills in the Treasury foreign series of dollar-denominated and foreign-currency-denominatedissues.5 Includes depository bonds, retirement plan bonds, Rural Electrification Administration bonds, State and local bonds, special issues held only by U.S.Government agencies and trust funds and the Federal home loan banks, and, for the period July 2003 through February 2004, depositary compensationsecurities.Note.—Through fiscal year 1976, the fiscal year was on a July 1–June 30 basis; beginning with October 1976 (fiscal year 1977), the fiscal year is on anOctober 1–September 30 basis.Source: Department of the Treasury.Other 5328 | Economic Report of the <strong>President</strong>
Table B–88.—Maturity distribution and average length of marketable interest-bearing public debtsecurities held by private investors, 1969–2007End of year or monthAmountoutstanding,privatelyheldWithin1 year1 to 5yearsMaturity class5 to 10years10 to 20years20 yearsand overAverage length 1Millions of dollars Years MonthsFiscal year:1969 156,008 69,311 50,182 18,078 6,097 12,337 4 21970 157,910 76,443 57,035 8,286 7,876 8,272 3 81971 161,863 74,803 58,557 14,503 6,357 7,645 3 61972 165,978 79,509 57,157 16,033 6,358 6,922 3 31973 167,869 84,041 54,139 16,385 8,741 4,564 3 11974 164,862 87,150 50,103 14,197 9,930 3,481 2 111975 210,382 115,677 65,852 15,385 8,857 4,611 2 81976 279,782 150,296 90,578 24,169 8,087 6,652 2 71977 326,674 161,329 113,319 33,067 8,428 10,531 2 111978 356,501 163,819 132,993 33,500 11,383 14,805 3 31979 380,530 181,883 127,574 32,279 18,489 20,304 3 71980 463,717 220,084 156,244 38,809 25,901 22,679 3 91981 549,863 256,187 182,237 48,743 32,569 30,127 4 01982 682,043 314,436 221,783 75,749 33,017 37,058 3 111983 862,631 379,579 294,955 99,174 40,826 48,097 4 11984 1,017,488 437,941 332,808 130,417 49,664 66,658 4 61985 1,185,675 472,661 402,766 159,383 62,853 88,012 4 111986 1,354,275 506,903 467,348 189,995 70,664 119,365 5 31987 1,445,366 483,582 526,746 209,160 72,862 153,016 5 91988 1,555,208 524,201 552,993 232,453 74,186 171,375 5 91989 1,654,660 546,751 578,333 247,428 80,616 201,532 6 01990 1,841,903 626,297 630,144 267,573 82,713 235,176 6 11991 2,113,799 713,778 761,243 280,574 84,900 273,304 6 01992 2,363,802 808,705 866,329 295,921 84,706 308,141 5 111993 2,562,336 858,135 978,714 306,663 94,345 324,479 5 101994 2,719,861 877,932 1,128,322 289,998 88,208 335,401 5 81995 2,870,781 1,002,875 1,157,492 290,111 87,297 333,006 5 41996 3,011,185 1,058,558 1,212,258 306,643 111,360 322,366 5 31997 2,998,846 1,017,913 1,206,993 321,622 154,205 298,113 5 51998 2,856,637 940,572 1,105,175 319,331 157,347 334,212 5 101999 2,728,011 915,145 962,644 378,163 149,703 322,356 6 02000 2,469,152 858,903 791,540 355,382 167,082 296,246 6 22001 2,328,302 900,178 650,522 329,247 174,653 273,702 6 12002 2,492,821 939,986 802,032 311,176 203,816 235,811 5 62003 2,804,092 1,057,049 955,239 351,552 243,755 196,497 5 12004 3,145,244 1,127,850 1,150,979 414,728 243,036 208,652 4 112005 3,334,411 1,100,783 1,279,646 499,386 281,229 173,367 4 102006 3,496,359 1,140,553 1,295,589 589,748 290,733 179,736 4 112007 3,634,666 1,176,510 1,309,871 677,905 291,963 178,417 4 102006: Jan 3,431,952 1,182,593 1,260,294 529,361 286,315 173,388 4 9Feb 3,508,777 1,238,763 1,275,570 526,340 292,517 175,586 4 9Mar 3,567,753 1,278,145 1,286,260 534,872 292,674 175,802 4 8Apr 3,483,412 1,198,187 1,273,413 543,174 292,741 175,897 4 9May 3,492,721 1,178,383 1,288,303 573,995 275,911 176,129 4 10June 3,473,551 1,136,203 1,302,488 582,153 276,216 176,491 4 10July 3,501,559 1,130,146 1,319,182 591,937 283,575 176,719 4 10Aug 3,563,832 1,195,210 1,316,350 581,832 290,832 179,608 4 10Sept 3,496,359 1,140,553 1,295,589 589,748 290,733 179,736 4 11Oct 3,555,382 1,136,163 1,350,430 598,143 290,822 179,824 4 10Nov 3,594,275 1,186,116 1,328,664 626,014 283,386 170,096 4 9Dec 3,524,921 1,136,717 1,303,590 632,680 282,368 169,566 4 102007: Jan 3,554,471 1,124,464 1,335,480 634,734 290,298 169,494 4 10Feb 3,613,660 1,171,311 1,332,822 640,611 298,399 170,517 4 10Mar 3,649,732 1,220,193 1,324,286 636,049 298,554 170,648 4 9Apr 3,611,093 1,128,525 1,357,728 655,774 298,188 170,878 4 10May 3,573,898 1,123,310 1,305,310 682,977 286,028 176,272 4 11June 3,514,691 1,075,672 1,296,936 679,143 286,376 176,564 4 11July 3,598,529 1,102,053 1,349,349 677,402 292,887 176,838 4 11Aug 3,702,458 1,215,692 1,333,432 682,935 291,975 178,425 4 10Sept 3,634,666 1,176,510 1,309,871 677,905 291,963 178,417 4 10Oct 3,671,046 1,171,587 1,332,632 696,633 291,857 178,337 4 10Nov 3,749,458 1,272,770 1,309,028 692,196 310,684 164,780 4 9Dec 3,781,877 1,295,981 1,309,642 700,562 310,814 164,878 4 91 Treasury inflation-protected securities—notes, first offered in 1997, and bonds, first offered in 1998—are included in the average length calculation from1997 forward.Note.—Through fiscal year 1976, the fiscal year was on a July 1–June 30 basis; beginning with October 1976 (fiscal year 1977), the fiscal year is on anOctober 1–September 30 basis.Data shown in this table are as of January 16, 2008.Source: Department of the Treasury.Appendix B – Government Finance | 329
- Page 1 and 2:
EconomicReportof thePresidentTransm
- Page 4 and 5:
C O N T E N T SPageECONOMIC REPORT
- Page 7 and 8:
ECONOMIC REPORT OF THE PRESIDENTTo
- Page 9:
$2 billion to a new international c
- Page 13:
LETTER OF TRANSMITTALCouncil of Eco
- Page 16 and 17:
chapter 3. the causes and consequen
- Page 18 and 19:
appendixesA. Report to the Presiden
- Page 20 and 21:
2-5. Mortgage Lending Today........
- Page 22 and 23:
Chapter 1: The Year in Reviewand th
- Page 24 and 25:
Chapter 3: The Causes and Consequen
- Page 26 and 27:
• Tax reductions in 2001 and 2003
- Page 28 and 29:
• More effective statistical use
- Page 30 and 31:
• Real GDP posted solid 2.5 perce
- Page 32 and 33:
elative to non-energy prices, while
- Page 34 and 35:
nonconforming mortgages in 2007. In
- Page 36 and 37:
In addition to incomes and mortgage
- Page 38 and 39:
Business InventoriesInventory inves
- Page 40 and 41:
Indeed, the growth in foreign econo
- Page 42 and 43:
During the 12 months of 2007, the u
- Page 44 and 45:
output measures announced in the an
- Page 46 and 47:
and government purchases. In contra
- Page 48 and 49:
Table 1-1.—Administration Economi
- Page 50 and 51:
Box 1-3 — continuedParticipation
- Page 52 and 53:
finalized), below its 1963-2006 ave
- Page 55 and 56:
C H A P T E R 2Credit and Housing M
- Page 57 and 58:
lends a debtor money today, which t
- Page 59 and 60:
Box 2-1 — continuedPrime loan: Lo
- Page 61 and 62:
Box 2-2 — continuedNRSROs. Critic
- Page 63 and 64:
Box 2-3 — continuedMortgage defau
- Page 65 and 66:
Box 2-3 — continuedmortgage defau
- Page 67 and 68:
Corporate bond yields also rose rel
- Page 69 and 70:
conduits in that SIVs have less acc
- Page 71 and 72:
International ImplicationsA notable
- Page 73 and 74:
come together to create a coordinat
- Page 75 and 76:
home is forgiven, that portion is t
- Page 77 and 78:
alternatives offered in the convent
- Page 79 and 80:
to such a change in wealth, which a
- Page 81:
lending. FHA Modernization will enc
- Page 84 and 85:
Economists often call attention to
- Page 86 and 87:
Box 3-1: Trade in ServicesDiscussio
- Page 88 and 89:
Box 3-2: The Current Account Defici
- Page 90 and 91:
Growth in Domestic ProductionA seco
- Page 92 and 93:
Exports and Foreign Direct Investme
- Page 94 and 95:
in CFIUS’s role in protecting nat
- Page 96 and 97:
these goods than if they were produ
- Page 98 and 99:
y import competition are electrical
- Page 101 and 102:
C H A P T E R 4The Importance of He
- Page 103 and 104:
Box 4-1: Health Effects on Job Prod
- Page 105 and 106:
health care spending growth. Rising
- Page 107 and 108:
While the study focused on spending
- Page 109 and 110:
Box 4-2 — continuedand without pr
- Page 111 and 112:
effective price of zero. Even if a
- Page 113 and 114:
deduction for health insurance to a
- Page 115 and 116:
To reduce the extent to which high-
- Page 117 and 118:
Administration supports broad adopt
- Page 119 and 120:
C H A P T E R 5Tax PolicySocieties
- Page 121 and 122:
in 2000. Tax revenues increased str
- Page 123 and 124:
Alternative Minimum TaxPrior to 196
- Page 125 and 126:
The Impact of Recent Tax Reductions
- Page 127 and 128:
35 percent marginal tax rate on the
- Page 129 and 130:
C corporations fall under the corpo
- Page 131 and 132:
Significance of Tax Cuts to Individ
- Page 133 and 134:
Box 5-1: Marriage Penalty BasicsIt
- Page 135 and 136:
The Structure of Business TaxesDesp
- Page 137 and 138:
investments are made. A more modest
- Page 139 and 140:
able to defer $35 of tax liability
- Page 141 and 142:
C H A P T E R 6The Nation’s Infra
- Page 143 and 144:
A monopolistic bridge owner may cho
- Page 145 and 146:
etween places to accommodating grow
- Page 147 and 148:
the same time. At hours when many d
- Page 149 and 150:
BridgesOn August 1, 2007, the I-35W
- Page 151 and 152:
where shippers have an alternative
- Page 153 and 154:
Freight shipments into and out of t
- Page 155 and 156:
Box 6-2: Delays at New York City Ai
- Page 157 and 158:
uilt, the marginal cost of transmis
- Page 159 and 160:
access was in mobile wireless conne
- Page 161 and 162:
Infrastructure PolicyThough the U.S
- Page 163 and 164:
could shorten the wait by adding an
- Page 165 and 166:
In 2005, the Federal Aviation Admin
- Page 167 and 168:
C H A P T E R 7Searching for Altern
- Page 169 and 170:
The first U.S. oil well was drilled
- Page 171 and 172:
Most of the oil consumed in the Uni
- Page 173 and 174:
Also, depending on the fuel and tec
- Page 175 and 176:
Table 7-1. —Estimated Average Lev
- Page 177 and 178:
Nevada. The facility is expected to
- Page 179 and 180:
Wind PowerWind power supplies about
- Page 181 and 182:
amounts of electricity, it could be
- Page 183 and 184:
years, as corn-based ethanol produc
- Page 185 and 186:
the power, range, and convenient fu
- Page 187 and 188:
other petroleum products is project
- Page 189 and 190:
To help meet the growing demand for
- Page 191 and 192:
C H A P T E R 8Improving Economic S
- Page 193 and 194:
The second largest Federal statisti
- Page 195 and 196:
As shown in Chart 8-3, spending on
- Page 197 and 198:
Monetary and fiscal policymakers al
- Page 199 and 200:
service-sector output much more fre
- Page 201 and 202:
Box 8-1: How to Reverse a Decline i
- Page 203 and 204:
Information Protection and Statisti
- Page 205 and 206:
forward instead of the growth rate
- Page 207:
Appendix AREPORT TO THE PRESIDENT O
- Page 210 and 211:
Council Members and Their Dates of
- Page 213 and 214:
Report to the President on theActiv
- Page 215 and 216:
The Council also prepared in-depth
- Page 217 and 218:
The Staff of the Council of Economi
- Page 219:
Jane Tufts, Bruce Kaplan, and Anna
- Page 223 and 224:
C O N T E N T SNational Income or E
- Page 225 and 226:
Prices—ContinuedPageB-63. Changes
- Page 227 and 228:
General NotesDetail in these tables
- Page 229 and 230:
Table B-1.—Gross domestic product
- Page 231 and 232:
Table B-2.—Real gross domestic pr
- Page 233 and 234:
Table B-4.—Percent changes in rea
- Page 235 and 236:
Table B-5.—Contributions to perce
- Page 237 and 238:
Table B-6.—Chain-type quantity in
- Page 239 and 240:
Table B-7.—Chain-type price index
- Page 241 and 242:
Table B-9.—Real gross domestic pr
- Page 243 and 244:
Table B-11.—Real gross value adde
- Page 245 and 246:
Table B-12.—Gross domestic produc
- Page 247 and 248:
Table B-13.—Real gross domestic p
- Page 249 and 250:
Table B-15.—Gross value added and
- Page 251 and 252:
Table B-17.—Real personal consump
- Page 253 and 254:
Table B-19.—Real private fixed in
- Page 255 and 256:
Table B-21.—Real government consu
- Page 257 and 258:
QuarterTable B-23.—Real private i
- Page 259 and 260:
Table B-25.—Real exports and impo
- Page 261 and 262:
Table B-27.—Relation of national
- Page 263 and 264:
Table B-28.—National income by ty
- Page 265 and 266:
Table B-29.—Sources of personal i
- Page 267 and 268:
Table B-31.—Total and per capita
- Page 269 and 270:
Table B-32.—Gross saving and inve
- Page 271 and 272:
Population, Employment, Wages, and
- Page 273 and 274:
Table B-35.—Civilian population a
- Page 275 and 276:
Table B-37.—Civilian employment b
- Page 277 and 278:
Table B-39.—Civilian labor force
- Page 279 and 280:
Table B-41.—Civilian employment/p
- Page 281 and 282: Table B-43.—Civilian unemployment
- Page 283 and 284: Table B-45.—Unemployment insuranc
- Page 285 and 286: Table B-46.—Employees on nonagric
- Page 287 and 288: Table B-48.—Employment cost index
- Page 289 and 290: Table B-50.—Changes in productivi
- Page 291 and 292: Table B-52.—Industrial production
- Page 293 and 294: Table B-54.—Capacity utilization
- Page 295 and 296: Table B-56.—New private housing u
- Page 297 and 298: Table B-58.—Manufacturers’ ship
- Page 299 and 300: PricesTable B-60.—Consumer price
- Page 301 and 302: Table B-61.—Consumer price indexe
- Page 303 and 304: Table B-63.—Changes in special co
- Page 305 and 306: Year or monthTable B-65.—Producer
- Page 307 and 308: Table B-66.—Producer price indexe
- Page 309 and 310: Table B-67.—Producer price indexe
- Page 311 and 312: Year and monthMoney Stock, Credit,
- Page 313 and 314: Table B-70.—Components of money s
- Page 315 and 316: Table B-72.—Bank credit at all co
- Page 317 and 318: Table B-73.—Bond yields and inter
- Page 319 and 320: Table B-74.—Credit market borrowi
- Page 321 and 322: Table B-76.—Mortgage debt outstan
- Page 323 and 324: Government FinanceTable B-78.—Fed
- Page 325 and 326: Table B-80.—Federal receipts and
- Page 327 and 328: Table B-82.—Federal and State and
- Page 329 and 330: Table B-84.—Federal Government cu
- Page 331: Table B-86.—State and local gover
- Page 335 and 336: Corporate Profits and FinanceTable
- Page 337 and 338: Table B-92.—Corporate profits of
- Page 339 and 340: Table B-94.—Relation of profits a
- Page 341 and 342: Year or monthTable B-96.—Common s
- Page 343 and 344: Table B-98.—Farm business balance
- Page 345 and 346: YearTotalTable B-100.—Farm input
- Page 347 and 348: Table B-102.—U.S. exports and imp
- Page 349 and 350: Table B-103.—U.S. international t
- Page 351 and 352: Table B-105.—U.S. international t
- Page 353 and 354: Table B-107.—International invest
- Page 355 and 356: Table B-109.—Civilian unemploymen
- Page 357 and 358: Table B-111.—International reserv