

President
ERP_Cover_Proofs with green barcode.indd - The American ...
ERP_Cover_Proofs with green barcode.indd - The American ...

You also want an ePaper? Increase the reach of your titles
YUMPU automatically turns print PDFs into web optimized ePapers that Google loves.
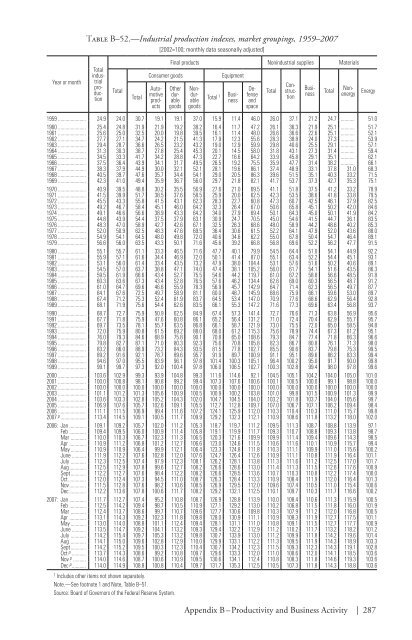
Table B–52.—Industrial production indexes, market groupings, 1959–2007[2002=100; monthly data seasonally adjusted]Year or monthTotalTotalConsumer goodsNonenergyAutomotiveproductsFinal products Nonindustrial supplies MaterialsOtherdurablegoodsNondurablegoodsTotal 1EquipmentBusinessDefenseandspaceTotalTotalTotalindustrialproductionConstructionBusinessEnergy1959 24.9 24.0 30.7 19.1 19.1 37.0 15.9 11.4 46.0 26.0 37.1 21.2 24.7 51.01960 25.4 24.8 31.9 21.9 19.2 38.2 16.4 11.7 47.2 26.1 36.3 21.9 25.1 51.71961 25.6 25.0 32.5 20.0 19.8 39.5 16.1 11.4 48.0 26.6 36.6 22.6 25.1 52.11962 27.7 27.1 34.7 24.2 21.5 41.3 17.9 12.3 55.6 28.3 38.8 24.0 27.3 53.91963 29.4 28.7 36.6 26.5 23.2 43.2 19.0 12.9 59.9 29.8 40.6 25.5 29.1 57.11964 31.3 30.3 38.7 27.8 25.4 45.3 20.1 14.5 58.0 31.8 43.1 27.3 31.4 59.41965 34.5 33.3 41.7 34.2 28.8 47.3 22.7 16.6 64.2 33.9 45.8 29.1 35.1 62.11966 37.5 36.4 43.9 34.1 31.7 49.5 26.5 19.2 75.5 35.9 47.7 31.4 38.2 66.11967 38.3 37.9 44.9 30.0 32.1 52.1 28.1 19.6 86.1 37.4 48.9 33.1 37.8 31.0 68.31968 40.5 39.7 47.6 35.7 34.4 54.1 29.0 20.5 86.3 39.6 51.5 35.1 40.3 33.2 71.51969 42.3 41.0 49.4 35.9 36.7 56.0 29.7 21.8 82.1 41.7 53.7 37.3 42.7 35.3 75.11970 40.9 39.5 48.8 30.2 35.5 56.9 27.6 21.0 69.5 41.1 51.8 37.5 41.2 33.2 78.91971 41.5 39.9 51.7 38.5 37.6 58.5 25.9 20.0 62.5 42.3 53.5 38.6 41.8 33.8 79.51972 45.5 43.3 55.8 41.5 43.1 62.3 28.3 22.7 60.8 47.3 60.7 42.5 46.1 37.9 82.51973 49.2 46.7 58.4 45.1 46.0 64.2 32.3 26.4 67.0 50.6 65.8 45.1 50.2 42.0 84.61974 49.1 46.6 56.6 38.9 43.3 64.2 34.0 27.9 69.4 50.1 64.3 45.0 50.1 41.9 84.21975 44.8 43.9 54.4 37.5 37.9 63.1 30.9 24.7 70.5 45.0 54.6 41.5 44.7 36.1 83.51976 48.3 47.0 58.9 42.7 42.6 67.1 32.5 26.3 68.6 48.0 58.9 44.2 48.6 40.2 85.31977 52.0 50.9 62.5 48.3 47.6 69.5 36.4 30.6 61.5 52.2 64.1 47.9 52.0 43.6 88.01978 54.9 54.1 64.5 48.0 49.8 72.0 40.6 34.6 62.2 55.0 67.8 50.4 54.7 46.4 89.11979 56.6 56.0 63.5 43.3 50.1 71.6 45.6 39.2 66.8 56.8 69.6 52.2 56.2 47.7 91.51980 55.1 55.7 61.1 33.3 46.5 71.6 47.7 40.1 79.9 54.5 64.4 51.0 54.1 44.9 92.21981 55.9 57.1 61.6 34.4 46.9 72.0 50.1 41.4 87.0 55.1 63.4 52.2 54.4 45.1 93.11982 53.1 56.0 61.4 33.4 43.5 73.2 47.9 38.0 104.4 53.1 57.6 51.6 50.2 40.6 89.11983 54.5 57.0 63.7 38.8 47.1 74.0 47.4 38.1 105.2 56.0 61.7 54.1 51.6 43.5 86.31984 59.5 61.9 66.6 43.4 52.7 75.5 54.6 44.2 119.7 61.0 67.2 58.8 56.6 48.5 91.81985 60.3 63.6 67.3 43.4 52.8 76.5 57.6 46.2 134.4 62.6 69.0 60.3 56.5 48.7 91.21986 61.0 64.7 69.6 46.6 55.9 78.3 56.9 45.7 142.9 64.7 71.4 62.3 56.5 49.7 87.71987 64.1 67.6 72.5 49.7 58.9 81.1 60.0 48.7 145.9 68.6 75.9 66.1 59.6 53.0 89.71988 67.4 71.2 75.3 52.4 61.9 83.7 64.5 53.4 147.0 70.9 77.6 68.6 62.9 56.4 92.81989 68.1 71.9 75.6 54.4 62.6 83.5 66.1 55.3 147.2 71.6 77.3 69.6 63.4 56.8 93.71990 68.7 72.7 75.9 50.9 62.5 84.9 67.4 57.3 141.4 72.7 76.6 71.3 63.8 56.9 95.61991 67.7 71.8 75.9 47.6 60.8 86.1 65.2 56.4 131.2 71.0 72.4 70.4 62.9 55.7 95.71992 69.7 73.5 78.1 55.7 63.5 86.8 66.1 58.7 121.9 73.0 75.5 72.0 65.0 58.5 94.81993 72.0 75.9 80.8 61.5 69.2 88.0 68.0 61.2 115.3 75.6 78.9 74.4 67.3 61.2 95.11994 76.0 79.3 84.6 68.9 75.8 90.1 70.8 65.0 108.6 79.3 84.7 77.4 71.8 66.3 96.61995 79.8 82.7 87.1 71.0 80.3 92.3 75.6 70.8 105.8 82.3 86.7 80.8 76.1 71.3 98.01996 83.2 86.0 88.9 73.2 84.3 93.5 81.5 77.8 102.7 85.5 90.6 83.7 79.8 75.3 99.51997 89.2 91.6 92.1 78.7 89.6 95.7 91.9 89.7 100.9 91.1 95.1 89.6 86.2 83.3 99.41998 94.6 97.0 95.5 83.9 96.1 97.8 101.4 100.3 105.1 96.4 100.2 95.0 91.7 90.0 99.81999 99.1 99.7 97.3 92.0 100.4 97.8 106.0 106.5 102.7 100.3 102.8 99.4 98.0 97.8 99.62000 103.6 102.9 99.3 93.9 104.8 99.3 111.6 114.6 92.1 104.5 105.1 104.2 104.0 105.0 101.02001 100.0 100.8 98.1 90.8 99.2 99.4 107.3 107.6 100.6 100.1 100.5 100.0 99.1 98.8 100.02002 100.0 100.0 100.0 100.0 100.0 100.0 100.0 100.0 100.0 100.0 100.0 100.0 100.0 100.0 100.02003 101.1 101.2 101.3 105.6 100.9 100.5 100.9 100.2 103.8 101.0 99.8 101.5 100.9 101.3 99.92004 103.6 103.3 102.8 105.2 104.3 102.0 104.7 104.5 104.0 103.2 101.8 103.7 104.0 105.6 99.72005 106.9 107.6 105.7 102.6 109.1 105.5 112.7 112.8 109.7 107.0 106.7 107.1 106.2 109.4 98.42006 111.1 111.5 106.9 99.4 111.6 107.2 124.1 125.9 112.0 110.3 110.4 110.3 111.0 115.7 99.82007 p 113.4 114.5 109.1 100.5 111.7 109.9 129.2 132.3 112.1 110.9 108.6 111.8 113.2 118.0 102.02006: Jan 109.1 109.2 105.7 102.0 111.2 105.3 118.7 119.7 111.2 109.5 111.3 108.7 108.8 113.9 97.1Feb 109.4 109.5 106.0 100.9 111.4 105.8 119.1 119.9 111.7 109.3 110.7 108.8 109.3 113.8 98.7Mar 110.0 110.3 106.7 102.3 111.3 106.5 120.3 121.6 109.9 109.9 111.4 109.4 109.6 114.3 98.5Apr 110.9 111.2 106.8 101.2 112.7 106.6 123.0 124.6 111.5 110.6 111.6 110.1 110.9 115.7 99.4May 110.9 110.9 106.4 99.9 112.1 106.4 123.3 124.8 111.8 110.3 111.1 109.9 111.0 115.6 100.2June 111.9 112.2 107.6 102.8 112.0 107.6 124.7 126.4 112.6 110.9 111.1 110.8 111.9 116.4 101.1July 112.3 112.5 107.4 97.9 112.3 108.1 126.2 128.1 113.8 111.3 111.6 111.2 112.5 117.0 101.7Aug 112.5 112.9 107.8 99.6 112.7 108.2 126.6 128.6 113.0 111.4 111.3 111.5 112.6 117.6 100.9Sept 112.2 112.7 107.6 98.4 112.2 108.2 126.6 128.5 113.6 110.7 110.3 110.8 112.2 117.4 100.0Oct 112.0 112.4 107.3 94.5 111.0 108.7 126.3 128.4 113.3 110.9 108.4 111.9 112.0 116.4 101.3Nov 111.5 112.8 107.6 98.2 110.6 108.5 126.9 129.5 112.0 109.6 107.4 110.5 111.0 115.4 100.6Dec 112.2 113.6 107.8 100.6 111.7 108.2 129.2 132.1 112.5 110.1 109.7 110.3 111.7 116.6 100.22007: Jan 111.7 112.7 107.4 95.2 110.8 108.7 126.9 128.8 113.9 110.0 108.4 110.6 111.3 115.9 100.5Feb 112.5 114.2 109.4 98.7 110.5 110.9 127.1 129.2 113.0 110.2 106.8 111.5 111.8 116.0 101.9Mar 112.4 113.7 108.6 99.7 110.7 109.6 127.7 130.6 109.8 110.3 107.9 111.2 112.0 116.8 100.5Apr 113.1 114.3 109.2 102.3 111.8 109.8 128.0 130.9 111.1 110.9 108.3 111.9 112.7 117.5 101.1May 113.0 114.0 108.8 101.1 112.4 109.4 128.1 131.1 111.0 110.8 109.1 111.5 112.7 117.7 100.9June 113.5 114.7 109.2 104.1 113.2 109.3 129.4 132.2 112.9 111.2 110.2 111.7 113.2 118.2 101.2July 114.2 115.4 109.7 105.3 113.2 109.8 130.7 133.9 113.0 111.2 109.9 111.8 114.2 119.6 101.4Aug 114.1 115.0 109.6 102.8 112.9 110.0 129.9 133.1 112.2 111.3 109.5 111.9 114.3 118.9 103.3Sept 114.2 115.2 109.5 100.3 112.3 110.4 130.7 134.2 112.3 111.5 109.3 112.3 114.3 119.1 102.8Oct p 113.7 114.3 108.6 99.2 110.8 109.7 129.6 133.3 112.0 111.0 108.6 112.0 114.1 118.5 103.6Nov p 114.0 114.6 108.7 100.6 110.9 109.5 130.6 134.1 112.4 110.8 108.3 111.8 114.6 119.3 103.6Dec p 114.0 114.9 108.8 100.8 110.4 109.7 131.7 135.3 112.5 110.5 107.3 111.8 114.3 118.8 103.61 Includes other items not shown separately.Note.—See footnote 1 and Note, Table B–51.Source: Board of Governors of the Federal Reserve System.Appendix B – Productivity and Business Activity | 287


