Year or monthTable B–44.—Unemployment by duration and reason, 1960–2007Lessthan 5weeks278 | Economic Report of the <strong>President</strong>[Thousands of persons, except as noted; monthly data seasonally adjusted 1 ]5-14weeksDuration of unemployment15-26weeks27weeksandoverAverage(mean)duration(weeks)Medianduration(weeks)TotalJob losers 3OnlayoffReason for unemploymentOtherJobleaversUnemploymentReentrantsNewentrants1960 3,852 1,719 1,176 503 454 12.8 1961 4,714 1,806 1,376 728 804 15.6 1962 3,911 1,663 1,134 534 585 14.7 1963 4,070 1,751 1,231 535 553 14.0 1964 3,786 1,697 1,117 491 482 13.3 1965 3,366 1,628 983 404 351 11.8 1966 2,875 1,573 779 287 239 10.4 1967 2 2,975 1,634 893 271 177 8.7 2.3 1,229 394 836 438 945 3961968 2,817 1,594 810 256 156 8.4 4.5 1,070 334 736 431 909 4071969 2,832 1,629 827 242 133 7.8 4.4 1,017 339 678 436 965 4131970 4,093 2,139 1,290 428 235 8.6 4.9 1,811 675 1,137 550 1,228 5041971 5,016 2,245 1,585 668 519 11.3 6.3 2,323 735 1,588 590 1,472 6301972 4,882 2,242 1,472 601 566 12.0 6.2 2,108 582 1,526 641 1,456 6771973 4,365 2,224 1,314 483 343 10.0 5.2 1,694 472 1,221 683 1,340 6491974 5,156 2,604 1,597 574 381 9.8 5.2 2,242 746 1,495 768 1,463 6811975 7,929 2,940 2,484 1,303 1,203 14.2 8.4 4,386 1,671 2,714 827 1,892 8231976 7,406 2,844 2,196 1,018 1,348 15.8 8.2 3,679 1,050 2,628 903 1,928 8951977 6,991 2,919 2,132 913 1,028 14.3 7.0 3,166 865 2,300 909 1,963 9531978 6,202 2,865 1,923 766 648 11.9 5.9 2,585 712 1,873 874 1,857 8851979 6,137 2,950 1,946 706 535 10.8 5.4 2,635 851 1,784 880 1,806 8171980 7,637 3,295 2,470 1,052 820 11.9 6.5 3,947 1,488 2,459 891 1,927 8721981 8,273 3,449 2,539 1,122 1,162 13.7 6.9 4,267 1,430 2,837 923 2,102 9811982 10,678 3,883 3,311 1,708 1,776 15.6 8.7 6,268 2,127 4,141 840 2,384 1,1851983 10,717 3,570 2,937 1,652 2,559 20.0 10.1 6,258 1,780 4,478 830 2,412 1,2161984 8,539 3,350 2,451 1,104 1,634 18.2 7.9 4,421 1,171 3,250 823 2,184 1,1101985 8,312 3,498 2,509 1,025 1,280 15.6 6.8 4,139 1,157 2,982 877 2,256 1,0391986 8,237 3,448 2,557 1,045 1,187 15.0 6.9 4,033 1,090 2,943 1,015 2,160 1,0291987 7,425 3,246 2,196 943 1,040 14.5 6.5 3,566 943 2,623 965 1,974 9201988 6,701 3,084 2,007 801 809 13.5 5.9 3,092 851 2,241 983 1,809 8161989 6,528 3,174 1,978 730 646 11.9 4.8 2,983 850 2,133 1,024 1,843 6771990 7,047 3,265 2,257 822 703 12.0 5.3 3,387 1,028 2,359 1,041 1,930 6881991 8,628 3,480 2,791 1,246 1,111 13.7 6.8 4,694 1,292 3,402 1,004 2,139 7921992 9,613 3,376 2,830 1,453 1,954 17.7 8.7 5,389 1,260 4,129 1,002 2,285 9371993 8,940 3,262 2,584 1,297 1,798 18.0 8.3 4,848 1,115 3,733 976 2,198 9191994 7,996 2,728 2,408 1,237 1,623 18.8 9.2 3,815 977 2,838 791 2,786 6041995 7,404 2,700 2,342 1,085 1,278 16.6 8.3 3,476 1,030 2,446 824 2,525 5791996 7,236 2,633 2,287 1,053 1,262 16.7 8.3 3,370 1,021 2,349 774 2,512 5801997 6,739 2,538 2,138 995 1,067 15.8 8.0 3,037 931 2,106 795 2,338 5691998 6,210 2,622 1,950 763 875 14.5 6.7 2,822 866 1,957 734 2,132 5201999 5,880 2,568 1,832 755 725 13.4 6.4 2,622 848 1,774 783 2,005 4692000 5,692 2,558 1,815 669 649 12.6 5.9 2,517 852 1,664 780 1,961 4342001 6,801 2,853 2,196 951 801 13.1 6.8 3,476 1,067 2,409 835 2,031 4592002 8,378 2,893 2,580 1,369 1,535 16.6 9.1 4,607 1,124 3,483 866 2,368 5362003 8,774 2,785 2,612 1,442 1,936 19.2 10.1 4,838 1,121 3,717 818 2,477 6412004 8,149 2,696 2,382 1,293 1,779 19.6 9.8 4,197 998 3,199 858 2,408 6862005 7,591 2,667 2,304 1,130 1,490 18.4 8.9 3,667 933 2,734 872 2,386 6662006 7,001 2,614 2,121 1,031 1,235 16.8 8.3 3,321 921 2,400 827 2,237 6162007 7,078 2,542 2,232 1,061 1,243 16.8 8.5 3,515 976 2,539 793 2,142 6272006: Jan 7,025 2,526 2,219 1,087 1,169 16.9 8.5 3,328 864 2,463 828 2,260 610Feb 7,143 2,576 2,090 1,176 1,330 17.8 8.9 3,370 879 2,491 846 2,280 694Mar 7,075 2,704 2,012 1,049 1,278 16.8 8.4 3,444 923 2,521 821 2,166 625Apr 7,113 2,662 2,133 1,014 1,324 16.7 8.4 3,495 899 2,596 857 2,174 574May 7,038 2,548 2,199 968 1,336 17.1 8.6 3,473 945 2,527 883 2,131 540June 7,017 2,678 2,083 979 1,156 16.7 7.7 3,385 988 2,397 810 2,166 640July 7,176 2,711 2,142 994 1,316 17.1 8.1 3,306 919 2,387 848 2,397 640Aug 7,128 2,595 2,273 1,017 1,309 17.1 8.4 3,282 898 2,383 851 2,292 655Sept 6,896 2,584 2,066 1,003 1,254 17.3 8.1 3,231 909 2,322 794 2,279 623Oct 6,735 2,603 2,066 1,005 1,088 16.4 8.1 3,097 956 2,141 784 2,261 580Nov 6,820 2,501 2,148 1,038 1,137 16.2 8.2 3,209 973 2,236 796 2,249 588Dec 6,760 2,650 2,013 994 1,099 16.1 7.5 3,242 968 2,274 803 2,169 5922007: Jan 7,043 2,596 2,298 995 1,138 16.5 8.2 3,399 1,017 2,382 791 2,195 615Feb 6,837 2,567 2,181 935 1,216 16.6 8.2 3,449 1,016 2,433 810 2,029 580Mar 6,738 2,338 2,156 976 1,207 17.2 8.6 3,240 865 2,375 755 2,143 600Apr 6,829 2,442 2,147 1,066 1,193 17.0 8.6 3,316 1,019 2,297 749 2,169 599May 6,863 2,467 2,187 1,099 1,137 16.6 8.3 3,375 997 2,379 768 2,149 557June 6,997 2,505 2,140 1,136 1,159 16.8 8.3 3,418 862 2,555 810 2,125 628July 7,137 2,496 2,220 1,091 1,311 17.3 8.9 3,629 983 2,646 823 2,082 602Aug 7,133 2,610 2,201 1,124 1,252 16.9 8.6 3,632 981 2,652 794 2,076 603Sept 7,246 2,537 2,330 1,112 1,280 16.6 8.9 3,622 963 2,660 839 2,154 685Oct 7,291 2,508 2,454 1,052 1,315 17.0 8.7 3,731 1,064 2,668 790 2,103 709Nov 7,181 2,633 2,157 1,014 1,384 17.2 8.7 3,609 979 2,630 783 2,160 669Dec 7,655 2,793 2,330 1,182 1,338 16.6 8.4 3,857 975 2,882 798 2,343 6971 Because of independent seasonal adjustment of the various series, detail will not sum to totals.2 For 1967, the sum of the unemployed categorized by reason for unemployment does not equal total unemployment.3 Beginning with January 1994, job losers and persons who completed temporary jobs.Note.—Data relate to persons 16 years of age and over.See footnote 5 and Note, Table B–35.Source: Department of Labor (Bureau of Labor Statistics).
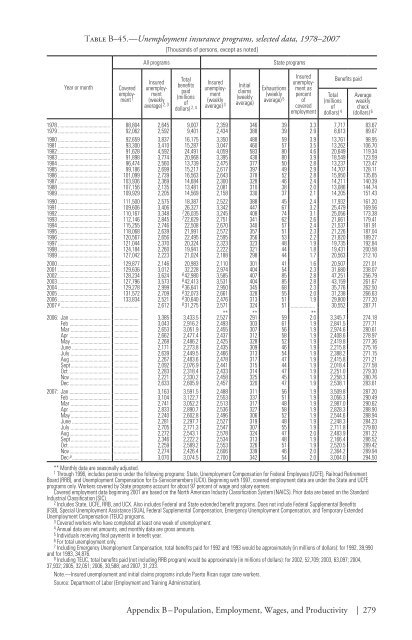
Table B–45.—Unemployment insurance programs, selected data, 1978–2007[Thousands of persons, except as noted]All programsState programsYear or monthCoveredemployment1Insuredunemployment(weeklyaverage) 2, 3Totalbenefitspaid(millionsofdollars) 2, 4Insuredunemployment(weeklyaverage) 3Initialclaims(weeklyaverage)Exhaustions(weeklyaverage) 5InsuredunemploymentaspercentofcoveredemploymentTotal(millionsofdollars) 4Benefits paidAverageweeklycheck(dollars) 61978 88,804 2,645 9,007 2,359 346 39 3.3 7,717 83.671979 92,062 2,592 9,401 2,434 388 39 2.9 8,613 89.671980 92,659 3,837 16,175 3,350 488 59 3.9 13,761 98.951981 93,300 3,410 15,287 3,047 460 57 3.5 13,262 106.701982 91,628 4,592 24,491 4,059 583 80 4.6 20,649 119.341983 91,898 3,774 20,968 3,395 438 80 3.9 18,549 123.591984 96,474 2,560 13,739 2,475 377 50 2.8 13,237 123.471985 99,186 2,699 15,217 2,617 397 49 2.9 14,707 128.111986 101,099 2,739 16,563 2,643 378 52 2.8 15,950 135.651987 103,936 2,369 14,684 2,300 328 46 2.4 14,211 140.391988 107,156 2,135 13,481 2,081 310 38 2.0 13,086 144.741989 109,929 2,205 14,569 2,158 330 37 2.1 14,205 151.431990 111,500 2,575 18,387 2,522 388 45 2.4 17,932 161.201991 109,606 3,406 26,327 3,342 447 67 3.2 25,479 169.561992 110,167 3,348 7 26,035 3,245 408 74 3.1 25,056 173.381993 112,146 2,845 7 22,629 2,751 341 62 2.6 21,661 179.411994 115,255 2,746 22,508 2,670 340 57 2.4 21,537 181.911995 118,068 2,639 21,991 2,572 357 51 2.3 21,226 187.041996 120,567 2,656 22,495 2,595 356 53 2.2 21,820 189.271997 121,044 2,370 20,324 2,323 323 48 1.9 19,735 192.841998 124,184 2,260 19,941 2,222 321 44 1.8 19,431 200.581999 127,042 2,223 21,024 2,188 298 44 1.7 20,563 212.102000 129,877 2,146 20,983 2,110 301 41 1.6 20,507 221.012001 129,636 3,012 32,228 2,974 404 54 2.3 31,680 238.072002 128,234 3,624 8 42,980 3,585 407 85 2.8 47,251 256.792003 127,796 3,573 8 42,413 3,531 404 85 2.8 43,159 261.672004 129,278 2,999 8 36,641 2,950 345 68 2.3 35,776 262.502005 131,572 2,709 8 32,073 2,661 328 55 2.0 31,238 266.632006 133,834 2,521 8 30,640 2,476 313 51 1.9 29,800 277.202007 p 2,612 8 31,275 2,571 324 51 30,552 287.712006: Jan 3,385 3,433.5**2,527**291 59**2.0 3,345.7 274.18Feb 3,043 2,916.2 2,493 303 61 1.9 2,841.5 277.71Mar 2,653 3,051.9 2,455 307 56 1.9 2,974.6 280.61Apr 2,662 2,477.4 2,437 312 58 1.9 2,408.6 278.97May 2,268 2,486.2 2,425 328 52 1.9 2,419.8 277.36June 2,171 2,273.8 2,435 309 46 1.9 2,215.8 275.16July 2,639 2,449.5 2,466 313 54 1.9 2,388.2 271.15Aug 2,267 2,483.6 2,478 317 47 1.9 2,415.8 271.21Sept 2,092 2,076.9 2,441 315 44 1.9 2,018.4 277.58Oct 2,283 2,318.4 2,433 314 47 1.9 2,251.0 279.30Nov 2,221 2,330.2 2,458 325 45 1.9 2,258.3 280.76Dec 2,633 2,605.9 2,457 320 47 1.9 2,538.1 283.612007: Jan 3,163 3,591.5 2,488 311 56 1.9 3,509.8 287.20Feb 3,104 3,122.7 2,553 337 51 1.9 3,056.3 290.49Mar 2,741 3,052.2 2,513 317 48 1.9 2,987.0 290.62Apr 2,833 2,890.7 2,536 327 58 1.9 2,828.3 288.90May 2,240 2,602.8 2,496 306 52 1.9 2,544.6 288.94June 2,281 2,297.7 2,527 319 48 1.9 2,248.3 284.23July 2,705 2,771.3 2,547 307 55 1.9 2,711.8 279.60Aug 2,272 2,543.1 2,578 324 47 2.0 2,483.9 281.22Sept 2,346 2,222.2 2,534 313 48 1.9 2,166.4 286.52Oct 2,259 2,589.2 2,553 326 51 1.9 2,520.5 289.42Nov 2,274 2,426.4 2,606 339 46 2.0 2,364.2 289.94Dec p 3,070 3,074.5 2,700 342 54 2.0 3,004.0 294.50** Monthly data are seasonally adjusted.1 Through 1996, includes persons under the following programs: State, Unemployment Compensation for Federal Employees (UCFE), Railroad RetirementBoard (RRB), and Unemployment Compensation for Ex-Servicemembers (UCX). Beginning with 1997, covered employment data are under the State and UCFEprograms only. Workers covered by State programs account for about 97 percent of wage and salary earners.Covered employment data beginning 2001 are based on the North American Industry Classification System (NAICS). Prior data are based on the StandardIndustrial Classification (SIC).2 Includes State, UCFE, RRB, and UCX. Also includes Federal and State extended benefit programs. Does not include Federal Supplemental Benefits(FSB), Special Unemployment Assistance (SUA), Federal Supplemental Compensation, Emergency Unemployment Compensation, and Temporary ExtendedUnemployment Compensation (TEUC) programs.3 Covered workers who have completed at least one week of unemployment.4 Annual data are net amounts, and monthly data are gross amounts.5 Individuals receiving final payments in benefit year.6 For total unemployment only.7 Including Emergency Unemployment Compensation, total benefits paid for 1992 and 1993 would be approximately (in millions of dollars): for 1992, 39,990and for 1993, 34,876.8 Including TEUC, total benefits paid (not including RRB program) would be approximately (in millions of dollars): for 2002, 52,709; 2003, 63,097; 2004,37,932; 2005, 32,051; 2006, 30,588; and 2007, 31,233.Note.—Insured unemployment and initial claims programs include Puerto Rican sugar cane workers.Source: Department of Labor (Employment and Training Administration).Appendix B – Population, Employment, Wages, and Productivity | 279
- Page 1 and 2:
EconomicReportof thePresidentTransm
- Page 4 and 5:
C O N T E N T SPageECONOMIC REPORT
- Page 7 and 8:
ECONOMIC REPORT OF THE PRESIDENTTo
- Page 9:
$2 billion to a new international c
- Page 13:
LETTER OF TRANSMITTALCouncil of Eco
- Page 16 and 17:
chapter 3. the causes and consequen
- Page 18 and 19:
appendixesA. Report to the Presiden
- Page 20 and 21:
2-5. Mortgage Lending Today........
- Page 22 and 23:
Chapter 1: The Year in Reviewand th
- Page 24 and 25:
Chapter 3: The Causes and Consequen
- Page 26 and 27:
• Tax reductions in 2001 and 2003
- Page 28 and 29:
• More effective statistical use
- Page 30 and 31:
• Real GDP posted solid 2.5 perce
- Page 32 and 33:
elative to non-energy prices, while
- Page 34 and 35:
nonconforming mortgages in 2007. In
- Page 36 and 37:
In addition to incomes and mortgage
- Page 38 and 39:
Business InventoriesInventory inves
- Page 40 and 41:
Indeed, the growth in foreign econo
- Page 42 and 43:
During the 12 months of 2007, the u
- Page 44 and 45:
output measures announced in the an
- Page 46 and 47:
and government purchases. In contra
- Page 48 and 49:
Table 1-1.—Administration Economi
- Page 50 and 51:
Box 1-3 — continuedParticipation
- Page 52 and 53:
finalized), below its 1963-2006 ave
- Page 55 and 56:
C H A P T E R 2Credit and Housing M
- Page 57 and 58:
lends a debtor money today, which t
- Page 59 and 60:
Box 2-1 — continuedPrime loan: Lo
- Page 61 and 62:
Box 2-2 — continuedNRSROs. Critic
- Page 63 and 64:
Box 2-3 — continuedMortgage defau
- Page 65 and 66:
Box 2-3 — continuedmortgage defau
- Page 67 and 68:
Corporate bond yields also rose rel
- Page 69 and 70:
conduits in that SIVs have less acc
- Page 71 and 72:
International ImplicationsA notable
- Page 73 and 74:
come together to create a coordinat
- Page 75 and 76:
home is forgiven, that portion is t
- Page 77 and 78:
alternatives offered in the convent
- Page 79 and 80:
to such a change in wealth, which a
- Page 81:
lending. FHA Modernization will enc
- Page 84 and 85:
Economists often call attention to
- Page 86 and 87:
Box 3-1: Trade in ServicesDiscussio
- Page 88 and 89:
Box 3-2: The Current Account Defici
- Page 90 and 91:
Growth in Domestic ProductionA seco
- Page 92 and 93:
Exports and Foreign Direct Investme
- Page 94 and 95:
in CFIUS’s role in protecting nat
- Page 96 and 97:
these goods than if they were produ
- Page 98 and 99:
y import competition are electrical
- Page 101 and 102:
C H A P T E R 4The Importance of He
- Page 103 and 104:
Box 4-1: Health Effects on Job Prod
- Page 105 and 106:
health care spending growth. Rising
- Page 107 and 108:
While the study focused on spending
- Page 109 and 110:
Box 4-2 — continuedand without pr
- Page 111 and 112:
effective price of zero. Even if a
- Page 113 and 114:
deduction for health insurance to a
- Page 115 and 116:
To reduce the extent to which high-
- Page 117 and 118:
Administration supports broad adopt
- Page 119 and 120:
C H A P T E R 5Tax PolicySocieties
- Page 121 and 122:
in 2000. Tax revenues increased str
- Page 123 and 124:
Alternative Minimum TaxPrior to 196
- Page 125 and 126:
The Impact of Recent Tax Reductions
- Page 127 and 128:
35 percent marginal tax rate on the
- Page 129 and 130:
C corporations fall under the corpo
- Page 131 and 132:
Significance of Tax Cuts to Individ
- Page 133 and 134:
Box 5-1: Marriage Penalty BasicsIt
- Page 135 and 136:
The Structure of Business TaxesDesp
- Page 137 and 138:
investments are made. A more modest
- Page 139 and 140:
able to defer $35 of tax liability
- Page 141 and 142:
C H A P T E R 6The Nation’s Infra
- Page 143 and 144:
A monopolistic bridge owner may cho
- Page 145 and 146:
etween places to accommodating grow
- Page 147 and 148:
the same time. At hours when many d
- Page 149 and 150:
BridgesOn August 1, 2007, the I-35W
- Page 151 and 152:
where shippers have an alternative
- Page 153 and 154:
Freight shipments into and out of t
- Page 155 and 156:
Box 6-2: Delays at New York City Ai
- Page 157 and 158:
uilt, the marginal cost of transmis
- Page 159 and 160:
access was in mobile wireless conne
- Page 161 and 162:
Infrastructure PolicyThough the U.S
- Page 163 and 164:
could shorten the wait by adding an
- Page 165 and 166:
In 2005, the Federal Aviation Admin
- Page 167 and 168:
C H A P T E R 7Searching for Altern
- Page 169 and 170:
The first U.S. oil well was drilled
- Page 171 and 172:
Most of the oil consumed in the Uni
- Page 173 and 174:
Also, depending on the fuel and tec
- Page 175 and 176:
Table 7-1. —Estimated Average Lev
- Page 177 and 178:
Nevada. The facility is expected to
- Page 179 and 180:
Wind PowerWind power supplies about
- Page 181 and 182:
amounts of electricity, it could be
- Page 183 and 184:
years, as corn-based ethanol produc
- Page 185 and 186:
the power, range, and convenient fu
- Page 187 and 188:
other petroleum products is project
- Page 189 and 190:
To help meet the growing demand for
- Page 191 and 192:
C H A P T E R 8Improving Economic S
- Page 193 and 194:
The second largest Federal statisti
- Page 195 and 196:
As shown in Chart 8-3, spending on
- Page 197 and 198:
Monetary and fiscal policymakers al
- Page 199 and 200:
service-sector output much more fre
- Page 201 and 202:
Box 8-1: How to Reverse a Decline i
- Page 203 and 204:
Information Protection and Statisti
- Page 205 and 206:
forward instead of the growth rate
- Page 207:
Appendix AREPORT TO THE PRESIDENT O
- Page 210 and 211:
Council Members and Their Dates of
- Page 213 and 214:
Report to the President on theActiv
- Page 215 and 216:
The Council also prepared in-depth
- Page 217 and 218:
The Staff of the Council of Economi
- Page 219:
Jane Tufts, Bruce Kaplan, and Anna
- Page 223 and 224:
C O N T E N T SNational Income or E
- Page 225 and 226:
Prices—ContinuedPageB-63. Changes
- Page 227 and 228:
General NotesDetail in these tables
- Page 229 and 230:
Table B-1.—Gross domestic product
- Page 231 and 232: Table B-2.—Real gross domestic pr
- Page 233 and 234: Table B-4.—Percent changes in rea
- Page 235 and 236: Table B-5.—Contributions to perce
- Page 237 and 238: Table B-6.—Chain-type quantity in
- Page 239 and 240: Table B-7.—Chain-type price index
- Page 241 and 242: Table B-9.—Real gross domestic pr
- Page 243 and 244: Table B-11.—Real gross value adde
- Page 245 and 246: Table B-12.—Gross domestic produc
- Page 247 and 248: Table B-13.—Real gross domestic p
- Page 249 and 250: Table B-15.—Gross value added and
- Page 251 and 252: Table B-17.—Real personal consump
- Page 253 and 254: Table B-19.—Real private fixed in
- Page 255 and 256: Table B-21.—Real government consu
- Page 257 and 258: QuarterTable B-23.—Real private i
- Page 259 and 260: Table B-25.—Real exports and impo
- Page 261 and 262: Table B-27.—Relation of national
- Page 263 and 264: Table B-28.—National income by ty
- Page 265 and 266: Table B-29.—Sources of personal i
- Page 267 and 268: Table B-31.—Total and per capita
- Page 269 and 270: Table B-32.—Gross saving and inve
- Page 271 and 272: Population, Employment, Wages, and
- Page 273 and 274: Table B-35.—Civilian population a
- Page 275 and 276: Table B-37.—Civilian employment b
- Page 277 and 278: Table B-39.—Civilian labor force
- Page 279 and 280: Table B-41.—Civilian employment/p
- Page 281: Table B-43.—Civilian unemployment
- Page 285 and 286: Table B-46.—Employees on nonagric
- Page 287 and 288: Table B-48.—Employment cost index
- Page 289 and 290: Table B-50.—Changes in productivi
- Page 291 and 292: Table B-52.—Industrial production
- Page 293 and 294: Table B-54.—Capacity utilization
- Page 295 and 296: Table B-56.—New private housing u
- Page 297 and 298: Table B-58.—Manufacturers’ ship
- Page 299 and 300: PricesTable B-60.—Consumer price
- Page 301 and 302: Table B-61.—Consumer price indexe
- Page 303 and 304: Table B-63.—Changes in special co
- Page 305 and 306: Year or monthTable B-65.—Producer
- Page 307 and 308: Table B-66.—Producer price indexe
- Page 309 and 310: Table B-67.—Producer price indexe
- Page 311 and 312: Year and monthMoney Stock, Credit,
- Page 313 and 314: Table B-70.—Components of money s
- Page 315 and 316: Table B-72.—Bank credit at all co
- Page 317 and 318: Table B-73.—Bond yields and inter
- Page 319 and 320: Table B-74.—Credit market borrowi
- Page 321 and 322: Table B-76.—Mortgage debt outstan
- Page 323 and 324: Government FinanceTable B-78.—Fed
- Page 325 and 326: Table B-80.—Federal receipts and
- Page 327 and 328: Table B-82.—Federal and State and
- Page 329 and 330: Table B-84.—Federal Government cu
- Page 331 and 332: Table B-86.—State and local gover
- Page 333 and 334:
Table B-88.—Maturity distribution
- Page 335 and 336:
Corporate Profits and FinanceTable
- Page 337 and 338:
Table B-92.—Corporate profits of
- Page 339 and 340:
Table B-94.—Relation of profits a
- Page 341 and 342:
Year or monthTable B-96.—Common s
- Page 343 and 344:
Table B-98.—Farm business balance
- Page 345 and 346:
YearTotalTable B-100.—Farm input
- Page 347 and 348:
Table B-102.—U.S. exports and imp
- Page 349 and 350:
Table B-103.—U.S. international t
- Page 351 and 352:
Table B-105.—U.S. international t
- Page 353 and 354:
Table B-107.—International invest
- Page 355 and 356:
Table B-109.—Civilian unemploymen
- Page 357 and 358:
Table B-111.—International reserv