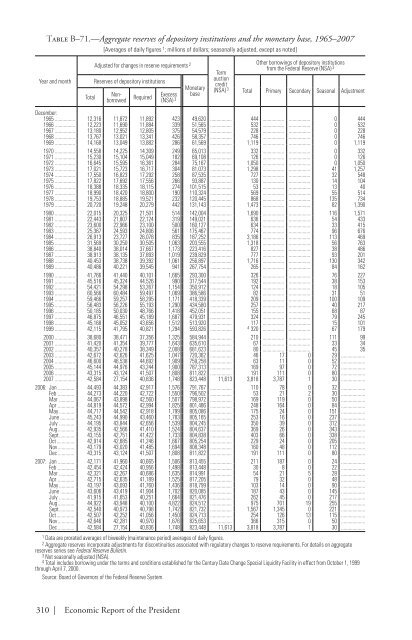
Table B–71.—Aggregate reserves of depository institutions and the monetary base, 1965–2007[Averages of daily figures 1 ; millions of dollars; seasonally adjusted, except as noted]Year and monthTotalAdjusted for changes in reserve requirements 2Reserves of depository institutionsNonborrowedRequiredExecess(NSA) 3MonetarybaseTermauctioncredit(NSA) 3Other borrowings of depository institutionsfrom the Federal Reserve (NSA) 3Total Primary Secondary Seasonal AdjustmentDecember:1965 12,316 11,872 11,892 423 49,620 444 0 4441966 12,223 11,690 11,884 339 51,565 532 0 5321967 13,180 12,952 12,805 375 54,579 228 0 2281968 13,767 13,021 13,341 426 58,357 746 0 7461969 14,168 13,049 13,882 286 61,569 1,119 0 1,1191970 14,558 14,225 14,309 249 65,013 332 0 3321971 15,230 15,104 15,049 182 69,108 126 0 1261972 16,645 15,595 16,361 284 75,167 1,050 0 1,0501973 17,021 15,723 16,717 304 81,073 1,298 41 1,2571974 17,550 16,823 17,292 258 87,535 727 32 5481975 17,822 17,692 17,556 266 93,887 130 14 1041976 18,388 18,335 18,115 274 101,515 53 13 401977 18,990 18,420 18,800 190 110,324 569 55 5141978 19,753 18,885 19,521 232 120,445 868 135 7341979 20,720 19,248 20,279 442 131,143 1,473 82 1,3901980 22,015 20,325 21,501 514 142,004 1,690 116 1,5711981 22,443 21,807 22,124 319 149,021 636 54 4331982 23,600 22,966 23,100 500 160,127 634 33 4151983 25,367 24,593 24,806 561 175,467 774 96 6761984 26,913 23,727 26,078 835 187,252 3,186 113 4691985 31,569 30,250 30,505 1,063 203,555 1,318 56 7631986 38,840 38,014 37,667 1,173 223,416 827 38 4861987 38,913 38,135 37,893 1,019 239,829 777 93 2011988 40,453 38,738 39,392 1,061 256,897 1,716 130 3421989 40,486 40,221 39,545 941 267,754 265 84 1621990 41,766 41,440 40,101 1,665 293,300 326 76 2271991 45,516 45,324 44,526 990 317,544 192 38 1531992 54,421 54,298 53,267 1,154 350,912 124 18 1051993 60,566 60,484 59,497 1,069 386,586 82 31 511994 59,466 59,257 58,295 1,171 418,339 209 100 1091995 56,483 56,226 55,193 1,290 434,580 257 40 2171996 50,185 50,030 48,766 1,418 452,051 155 68 871997 46,875 46,551 45,189 1,687 479,931 324 79 2451998 45,168 45,052 43,656 1,512 513,920 117 15 1011999 42,115 41,795 40,821 1,294 593,826 4 320 67 1792000 38,680 38,471 37,356 1,325 584,944 210 111 992001 41,420 41,354 39,777 1,643 635,610 67 33 342002 40,357 40,278 38,349 2,008 681,623 80 45 352003 42,672 42,626 41,625 1,047 720,362 46 17 0 29 2004 46,600 46,538 44,692 1,909 759,258 63 11 0 52 2005 45,144 44,976 43,244 1,900 787,313 169 97 0 72 2006 43,315 43,124 41,507 1,808 811,822 191 111 0 80 2007 42,584 27,154 40,836 1,748 823,448 11,613 3,818 3,787 1 30 2006: Jan 44,493 44,383 42,917 1,576 791,767 110 78 0 32 Feb 44,273 44,220 42,722 1,550 796,502 53 21 2 30 Mar 44,067 43,898 42,560 1,507 798,972 169 119 0 50 Apr 44,819 44,572 42,994 1,825 801,486 248 164 0 84 May 44,717 44,542 42,918 1,799 805,086 175 24 0 151 June 45,243 44,990 43,460 1,783 805,165 253 16 0 237 July 44,195 43,844 42,656 1,539 804,245 350 39 0 312 Aug 42,935 42,566 41,410 1,524 804,637 369 26 0 343 Sept 43,155 42,751 41,422 1,733 804,838 403 66 0 338 Oct 42,914 42,685 41,246 1,667 805,254 229 24 0 205 Nov 43,179 43,020 41,485 1,694 808,348 160 48 0 112 Dec 43,315 43,124 41,507 1,808 811,822 191 111 0 80 2007: Jan 42,171 41,960 40,665 1,506 813,455 211 187 0 24 Feb 42,454 42,424 40,956 1,498 813,448 30 8 0 22 Mar 42,321 42,267 40,686 1,635 814,991 54 21 5 28 Apr 42,715 42,635 41,189 1,525 817,205 79 32 0 48 May 43,197 43,093 41,760 1,436 818,799 103 14 0 90 June 43,606 43,419 41,904 1,702 820,085 187 43 0 145 July 41,915 41,653 40,251 1,664 821,476 262 45 0 217 Aug 44,922 43,948 40,100 4,822 824,512 975 701 19 255 Sept 42,540 40,973 40,798 1,742 821,732 1,567 1,345 0 221 Oct 42,507 42,252 41,056 1,450 824,713 254 126 13 115 Nov 42,646 42,281 40,970 1,676 825,653 366 315 0 50 Dec 42,584 27,154 40,836 1,748 823,448 11,613 3,818 3,787 1 30 1 Data are prorated averages of biweekly (maintenance period) averages of daily figures.2 Aggregate reserves incorporate adjustments for discontinuities associated with regulatory changes to reserve requirements. For details on aggregatereserves series see Federal Reserve Bulletin.3 Not seasonally adjusted (NSA).4 Total includes borrowing under the terms and conditions established for the Century Date Change Special Liquidity Facility in effect from October 1, 1999through April 7, 2000.Source: Board of Governors of the Federal Reserve System.310 | Economic Report of the <strong>President</strong>
Table B–72.—Bank credit at all commercial banks, 1965–2007[Monthly average; billions of dollars, seasonally adjusted 1 ]Securities in bank creditLoans and leases in bank creditYear and monthTotalbankcreditTotalsecuritiesU.S.TreasuryandagencysecuritiesTotalloansandleases 2OthersecuritiesCommercialandindustrialReal estateDecember:1965 297.1 96.1 64.3 31.9 201.0 69.5 48.9 45.0 8.0 29.71966 318.6 97.2 61.0 36.2 221.4 79.3 53.8 47.7 8.3 32.41967 350.5 111.4 70.7 40.6 239.2 86.5 58.2 51.2 9.6 33.81968 390.5 121.9 73.8 48.1 268.6 96.5 64.8 57.7 10.5 39.21969 401.6 112.4 64.2 48.2 289.2 106.9 69.9 62.6 10.0 39.81970 434.4 129.7 73.4 56.3 304.6 111.6 72.9 65.3 10.4 44.51971 485.2 147.5 79.8 67.7 337.6 118.0 81.7 73.3 10.9 53.91972 555.3 160.6 85.4 75.2 394.7 133.6 98.8 85.4 14.4 62.51973 638.6 168.4 89.7 78.7 470.1 162.8 119.4 119.4 98.3 11.2 78.41974 701.7 173.8 87.9 85.9 527.9 193.0 132.5 132.5 102.1 10.6 89.61975 732.9 206.7 117.9 88.9 526.2 184.3 137.2 137.2 104.6 12.7 87.51976 790.7 228.6 137.3 91.3 562.1 186.3 151.3 151.3 115.9 17.7 91.01977 876.0 236.3 137.4 98.9 639.7 205.8 178.0 178.0 138.1 20.7 97.21978 989.4 242.2 138.4 103.8 747.2 239.0 213.5 213.5 164.6 19.1 110.91979 1,111.4 260.7 147.2 113.4 850.7 282.2 245.0 245.0 184.5 17.4 121.61980 1,207.1 296.8 173.2 123.6 910.3 314.5 265.7 265.7 179.2 17.2 133.61981 1,302.7 311.1 181.8 129.3 991.6 353.3 287.5 287.5 182.7 20.2 148.01982 1,412.3 338.6 204.7 133.9 1,073.7 396.4 303.8 303.8 188.2 23.6 161.71983 1,566.7 403.8 263.4 140.4 1,163.0 419.1 334.8 334.8 213.2 26.5 169.41984 1,733.4 406.6 262.9 143.7 1,326.9 479.4 380.8 380.8 253.6 34.1 179.01985 1,922.2 455.9 273.8 182.2 1,466.3 506.5 431.0 431.0 294.5 42.9 191.41986 2,106.6 510.0 312.8 197.2 1,596.5 544.0 499.9 499.9 314.5 38.6 199.51987 2,255.3 535.0 338.9 196.1 1,720.2 575.0 595.7 32.2 563.5 327.7 34.8 187.01988 2,445.4 561.4 365.9 195.5 1,884.0 612.0 676.6 42.6 634.0 354.9 39.8 200.71989 2,611.8 585.5 401.0 184.6 2,026.3 642.4 769.4 53.5 715.9 375.3 40.6 198.51990 2,756.4 635.8 457.5 178.4 2,120.6 644.8 856.7 66.4 790.3 380.8 43.8 194.51991 2,871.7 746.2 566.5 179.7 2,125.5 622.2 882.9 74.3 808.6 363.9 52.5 204.01992 2,989.6 842.8 666.5 176.3 2,146.8 598.0 905.9 78.5 827.4 356.2 60.6 226.11993 3,143.8 916.9 732.7 184.2 2,227.0 588.7 946.8 78.1 868.7 387.4 81.8 222.31994 3,317.6 940.2 722.5 217.7 2,377.4 647.9 1,010.5 80.5 930.0 447.9 70.9 200.21995 3,599.1 984.6 702.2 282.5 2,614.5 718.6 1,091.0 84.5 1,006.4 491.1 79.5 234.31996 3,755.4 984.6 703.0 281.5 2,770.9 778.6 1,143.8 90.9 1,052.9 512.2 70.7 265.61997 4,099.1 1,099.0 755.6 343.4 3,000.1 848.0 1,246.2 105.0 1,141.2 502.5 88.2 315.21998 4,534.1 1,237.4 797.0 440.4 3,296.7 940.9 1,337.0 103.9 1,233.1 496.9 135.2 386.71999 4,762.7 1,280.8 812.6 468.2 3,481.9 992.3 1,475.4 101.5 1,373.9 490.8 139.9 383.52000 5,221.4 1,347.4 790.1 557.3 3,874.0 1,080.3 1,658.1 130.2 1,528.0 540.2 160.6 434.82001 5,423.3 1,487.2 848.3 638.9 3,936.1 1,019.6 1,785.7 155.8 1,629.9 557.4 134.0 439.32002 5,886.5 1,715.0 1,022.6 692.3 4,171.5 956.8 2,030.8 213.7 1,817.1 588.0 171.8 424.22003 6,259.2 1,849.1 1,104.8 744.3 4,410.0 897.7 2,225.9 281.0 1,944.9 645.1 195.4 445.92004 6,805.8 1,936.2 1,153.3 782.8 4,869.6 920.5 2,568.2 399.9 2,168.2 697.0 194.2 489.72005 7,514.0 2,050.4 1,141.4 909.0 5,463.6 1,039.1 2,928.9 446.7 2,482.2 708.0 241.8 545.82006 8,349.0 2,227.4 1,196.0 1,031.4 6,121.7 1,193.8 3,369.5 471.3 2,898.1 741.8 266.0 550.72007 9,224.4 2,440.9 1,110.9 1,330.0 6,783.5 1,437.1 3,583.6 486.6 3,097.1 804.0 288.5 670.32006: Jan 7,569.6 2,066.8 1,152.6 914.1 5,502.8 1,053.8 2,955.3 447.3 2,507.9 712.2 232.9 548.6Feb 7,652.7 2,104.4 1,180.8 923.7 5,548.3 1,063.0 2,979.5 446.9 2,532.6 711.8 239.7 554.3Mar 7,724.9 2,115.7 1,185.8 929.9 5,609.2 1,074.3 3,009.7 450.2 2,559.5 722.5 244.8 557.9Apr 7,815.7 2,168.9 1,198.2 970.7 5,646.9 1,091.6 3,033.2 446.1 2,587.1 727.5 235.1 559.5May 7,929.1 2,204.5 1,194.9 1,009.7 5,724.6 1,111.8 3,059.1 442.4 2,616.7 734.5 251.2 567.9June 7,939.6 2,187.3 1,200.5 986.7 5,752.4 1,119.8 3,101.8 444.8 2,657.0 729.2 231.6 570.0July 7,987.1 2,192.5 1,212.4 980.1 5,794.6 1,131.2 3,140.7 452.0 2,688.7 722.5 229.9 570.3Aug 8,049.0 2,205.6 1,221.1 984.5 5,843.4 1,160.4 3,142.4 448.1 2,694.2 728.4 237.6 574.5Sept 8,071.8 2,192.5 1,210.8 981.8 5,879.2 1,164.8 3,165.0 450.6 2,714.4 727.8 249.9 571.8Oct 8,225.2 2,216.2 1,222.9 993.2 6,009.0 1,178.2 3,313.6 466.4 2,847.1 729.5 252.5 535.3Nov 8,274.5 2,225.0 1,215.3 1,009.7 6,049.5 1,183.5 3,330.5 468.1 2,862.4 734.5 261.6 539.6Dec 8,349.0 2,227.4 1,196.0 1,031.4 6,121.7 1,193.8 3,369.5 471.3 2,898.1 741.8 266.0 550.72007: Jan 8,407.5 2,233.4 1,198.5 1,034.9 6,174.0 1,201.4 3,400.4 473.3 2,927.1 749.8 267.8 554.6Feb 8,479.7 2,248.2 1,202.9 1,045.3 6,231.5 1,211.5 3,430.9 471.0 2,959.9 749.8 278.6 560.8Mar 8,458.7 2,272.4 1,210.5 1,061.9 6,186.3 1,219.9 3,373.4 462.6 2,910.8 747.2 284.7 561.1Apr 8,521.3 2,284.0 1,186.3 1,097.7 6,237.3 1,226.8 3,396.4 458.1 2,938.2 753.2 282.0 578.9May 8,578.6 2,289.5 1,173.9 1,115.6 6,289.2 1,243.8 3,414.0 458.3 2,955.7 756.7 295.5 579.2June 8,628.8 2,308.9 1,177.8 1,131.1 6,319.9 1,261.8 3,441.6 459.6 2,982.0 767.0 269.2 580.3July 8,694.4 2,318.3 1,180.6 1,137.7 6,376.1 1,281.0 3,458.6 462.4 2,996.2 774.7 270.6 591.2Aug 8,821.3 2,342.6 1,186.1 1,156.5 6,478.7 1,313.4 3,471.2 465.9 3,005.3 777.2 285.7 631.3Sept 8,947.4 2,371.8 1,171.0 1,200.7 6,575.7 1,361.3 3,496.0 470.1 3,025.9 784.4 280.7 653.2Oct 9,063.8 2,403.1 1,135.4 1,267.7 6,660.7 1,396.4 3,549.6 476.3 3,073.3 781.8 264.4 668.4Nov 9,181.7 2,466.5 1,118.5 1,348.0 6,715.2 1,411.9 3,569.4 481.3 3,088.1 792.3 278.4 663.3Dec 9,224.4 2,440.9 1,110.9 1,330.0 6,783.5 1,437.1 3,583.6 486.6 3,097.1 804.0 288.5 670.3TotalSecurityRevolvinghomeequity1 Data are prorated averages of Wednesday values for domestically chartered commercial banks, branches and agencies of foreign banks, New York Stateinvestment companies (through September 1996), and Edge Act and agreement corporations.2 Excludes Federal funds sold to, reverse repurchase agreements (RPs) with, and loans to commercial banks in the United States.Source: Board of Governors of the Federal Reserve System.OtherConsumerOtherAppendix B – Money Stock, Credit, and Finance | 311
- Page 1 and 2:
EconomicReportof thePresidentTransm
- Page 4 and 5:
C O N T E N T SPageECONOMIC REPORT
- Page 7 and 8:
ECONOMIC REPORT OF THE PRESIDENTTo
- Page 9:
$2 billion to a new international c
- Page 13:
LETTER OF TRANSMITTALCouncil of Eco
- Page 16 and 17:
chapter 3. the causes and consequen
- Page 18 and 19:
appendixesA. Report to the Presiden
- Page 20 and 21:
2-5. Mortgage Lending Today........
- Page 22 and 23:
Chapter 1: The Year in Reviewand th
- Page 24 and 25:
Chapter 3: The Causes and Consequen
- Page 26 and 27:
• Tax reductions in 2001 and 2003
- Page 28 and 29:
• More effective statistical use
- Page 30 and 31:
• Real GDP posted solid 2.5 perce
- Page 32 and 33:
elative to non-energy prices, while
- Page 34 and 35:
nonconforming mortgages in 2007. In
- Page 36 and 37:
In addition to incomes and mortgage
- Page 38 and 39:
Business InventoriesInventory inves
- Page 40 and 41:
Indeed, the growth in foreign econo
- Page 42 and 43:
During the 12 months of 2007, the u
- Page 44 and 45:
output measures announced in the an
- Page 46 and 47:
and government purchases. In contra
- Page 48 and 49:
Table 1-1.—Administration Economi
- Page 50 and 51:
Box 1-3 — continuedParticipation
- Page 52 and 53:
finalized), below its 1963-2006 ave
- Page 55 and 56:
C H A P T E R 2Credit and Housing M
- Page 57 and 58:
lends a debtor money today, which t
- Page 59 and 60:
Box 2-1 — continuedPrime loan: Lo
- Page 61 and 62:
Box 2-2 — continuedNRSROs. Critic
- Page 63 and 64:
Box 2-3 — continuedMortgage defau
- Page 65 and 66:
Box 2-3 — continuedmortgage defau
- Page 67 and 68:
Corporate bond yields also rose rel
- Page 69 and 70:
conduits in that SIVs have less acc
- Page 71 and 72:
International ImplicationsA notable
- Page 73 and 74:
come together to create a coordinat
- Page 75 and 76:
home is forgiven, that portion is t
- Page 77 and 78:
alternatives offered in the convent
- Page 79 and 80:
to such a change in wealth, which a
- Page 81:
lending. FHA Modernization will enc
- Page 84 and 85:
Economists often call attention to
- Page 86 and 87:
Box 3-1: Trade in ServicesDiscussio
- Page 88 and 89:
Box 3-2: The Current Account Defici
- Page 90 and 91:
Growth in Domestic ProductionA seco
- Page 92 and 93:
Exports and Foreign Direct Investme
- Page 94 and 95:
in CFIUS’s role in protecting nat
- Page 96 and 97:
these goods than if they were produ
- Page 98 and 99:
y import competition are electrical
- Page 101 and 102:
C H A P T E R 4The Importance of He
- Page 103 and 104:
Box 4-1: Health Effects on Job Prod
- Page 105 and 106:
health care spending growth. Rising
- Page 107 and 108:
While the study focused on spending
- Page 109 and 110:
Box 4-2 — continuedand without pr
- Page 111 and 112:
effective price of zero. Even if a
- Page 113 and 114:
deduction for health insurance to a
- Page 115 and 116:
To reduce the extent to which high-
- Page 117 and 118:
Administration supports broad adopt
- Page 119 and 120:
C H A P T E R 5Tax PolicySocieties
- Page 121 and 122:
in 2000. Tax revenues increased str
- Page 123 and 124:
Alternative Minimum TaxPrior to 196
- Page 125 and 126:
The Impact of Recent Tax Reductions
- Page 127 and 128:
35 percent marginal tax rate on the
- Page 129 and 130:
C corporations fall under the corpo
- Page 131 and 132:
Significance of Tax Cuts to Individ
- Page 133 and 134:
Box 5-1: Marriage Penalty BasicsIt
- Page 135 and 136:
The Structure of Business TaxesDesp
- Page 137 and 138:
investments are made. A more modest
- Page 139 and 140:
able to defer $35 of tax liability
- Page 141 and 142:
C H A P T E R 6The Nation’s Infra
- Page 143 and 144:
A monopolistic bridge owner may cho
- Page 145 and 146:
etween places to accommodating grow
- Page 147 and 148:
the same time. At hours when many d
- Page 149 and 150:
BridgesOn August 1, 2007, the I-35W
- Page 151 and 152:
where shippers have an alternative
- Page 153 and 154:
Freight shipments into and out of t
- Page 155 and 156:
Box 6-2: Delays at New York City Ai
- Page 157 and 158:
uilt, the marginal cost of transmis
- Page 159 and 160:
access was in mobile wireless conne
- Page 161 and 162:
Infrastructure PolicyThough the U.S
- Page 163 and 164:
could shorten the wait by adding an
- Page 165 and 166:
In 2005, the Federal Aviation Admin
- Page 167 and 168:
C H A P T E R 7Searching for Altern
- Page 169 and 170:
The first U.S. oil well was drilled
- Page 171 and 172:
Most of the oil consumed in the Uni
- Page 173 and 174:
Also, depending on the fuel and tec
- Page 175 and 176:
Table 7-1. —Estimated Average Lev
- Page 177 and 178:
Nevada. The facility is expected to
- Page 179 and 180:
Wind PowerWind power supplies about
- Page 181 and 182:
amounts of electricity, it could be
- Page 183 and 184:
years, as corn-based ethanol produc
- Page 185 and 186:
the power, range, and convenient fu
- Page 187 and 188:
other petroleum products is project
- Page 189 and 190:
To help meet the growing demand for
- Page 191 and 192:
C H A P T E R 8Improving Economic S
- Page 193 and 194:
The second largest Federal statisti
- Page 195 and 196:
As shown in Chart 8-3, spending on
- Page 197 and 198:
Monetary and fiscal policymakers al
- Page 199 and 200:
service-sector output much more fre
- Page 201 and 202:
Box 8-1: How to Reverse a Decline i
- Page 203 and 204:
Information Protection and Statisti
- Page 205 and 206:
forward instead of the growth rate
- Page 207:
Appendix AREPORT TO THE PRESIDENT O
- Page 210 and 211:
Council Members and Their Dates of
- Page 213 and 214:
Report to the President on theActiv
- Page 215 and 216:
The Council also prepared in-depth
- Page 217 and 218:
The Staff of the Council of Economi
- Page 219:
Jane Tufts, Bruce Kaplan, and Anna
- Page 223 and 224:
C O N T E N T SNational Income or E
- Page 225 and 226:
Prices—ContinuedPageB-63. Changes
- Page 227 and 228:
General NotesDetail in these tables
- Page 229 and 230:
Table B-1.—Gross domestic product
- Page 231 and 232:
Table B-2.—Real gross domestic pr
- Page 233 and 234:
Table B-4.—Percent changes in rea
- Page 235 and 236:
Table B-5.—Contributions to perce
- Page 237 and 238:
Table B-6.—Chain-type quantity in
- Page 239 and 240:
Table B-7.—Chain-type price index
- Page 241 and 242:
Table B-9.—Real gross domestic pr
- Page 243 and 244:
Table B-11.—Real gross value adde
- Page 245 and 246:
Table B-12.—Gross domestic produc
- Page 247 and 248:
Table B-13.—Real gross domestic p
- Page 249 and 250:
Table B-15.—Gross value added and
- Page 251 and 252:
Table B-17.—Real personal consump
- Page 253 and 254:
Table B-19.—Real private fixed in
- Page 255 and 256:
Table B-21.—Real government consu
- Page 257 and 258:
QuarterTable B-23.—Real private i
- Page 259 and 260:
Table B-25.—Real exports and impo
- Page 261 and 262:
Table B-27.—Relation of national
- Page 263 and 264: Table B-28.—National income by ty
- Page 265 and 266: Table B-29.—Sources of personal i
- Page 267 and 268: Table B-31.—Total and per capita
- Page 269 and 270: Table B-32.—Gross saving and inve
- Page 271 and 272: Population, Employment, Wages, and
- Page 273 and 274: Table B-35.—Civilian population a
- Page 275 and 276: Table B-37.—Civilian employment b
- Page 277 and 278: Table B-39.—Civilian labor force
- Page 279 and 280: Table B-41.—Civilian employment/p
- Page 281 and 282: Table B-43.—Civilian unemployment
- Page 283 and 284: Table B-45.—Unemployment insuranc
- Page 285 and 286: Table B-46.—Employees on nonagric
- Page 287 and 288: Table B-48.—Employment cost index
- Page 289 and 290: Table B-50.—Changes in productivi
- Page 291 and 292: Table B-52.—Industrial production
- Page 293 and 294: Table B-54.—Capacity utilization
- Page 295 and 296: Table B-56.—New private housing u
- Page 297 and 298: Table B-58.—Manufacturers’ ship
- Page 299 and 300: PricesTable B-60.—Consumer price
- Page 301 and 302: Table B-61.—Consumer price indexe
- Page 303 and 304: Table B-63.—Changes in special co
- Page 305 and 306: Year or monthTable B-65.—Producer
- Page 307 and 308: Table B-66.—Producer price indexe
- Page 309 and 310: Table B-67.—Producer price indexe
- Page 311 and 312: Year and monthMoney Stock, Credit,
- Page 313: Table B-70.—Components of money s
- Page 317 and 318: Table B-73.—Bond yields and inter
- Page 319 and 320: Table B-74.—Credit market borrowi
- Page 321 and 322: Table B-76.—Mortgage debt outstan
- Page 323 and 324: Government FinanceTable B-78.—Fed
- Page 325 and 326: Table B-80.—Federal receipts and
- Page 327 and 328: Table B-82.—Federal and State and
- Page 329 and 330: Table B-84.—Federal Government cu
- Page 331 and 332: Table B-86.—State and local gover
- Page 333 and 334: Table B-88.—Maturity distribution
- Page 335 and 336: Corporate Profits and FinanceTable
- Page 337 and 338: Table B-92.—Corporate profits of
- Page 339 and 340: Table B-94.—Relation of profits a
- Page 341 and 342: Year or monthTable B-96.—Common s
- Page 343 and 344: Table B-98.—Farm business balance
- Page 345 and 346: YearTotalTable B-100.—Farm input
- Page 347 and 348: Table B-102.—U.S. exports and imp
- Page 349 and 350: Table B-103.—U.S. international t
- Page 351 and 352: Table B-105.—U.S. international t
- Page 353 and 354: Table B-107.—International invest
- Page 355 and 356: Table B-109.—Civilian unemploymen
- Page 357 and 358: Table B-111.—International reserv