Table B–30.—Disposition of personal income, 1959–2007[Billions of dollars, except as noted; quarterly data at seasonally adjusted annual rates]Year or quarterPersonalincomeLess:PersonalcurrenttaxesEquals:DisposablepersonalincomeTotalLess: Personal outlaysPersonalconsumptionexpendituresPersonalinterestpayments1PersonalcurrenttransferpaymentsEquals:PersonalsavingPercent of disposablepersonal income 2Personal outlaysTotalPersonalconsumptionexpendituresPersonalsaving1959 392.8 42.3 350.5 323.9 317.6 5.5 0.8 26.7 92.4 90.6 7.61960 411.5 46.1 365.4 338.8 331.7 6.2 .8 26.7 92.7 90.8 7.31961 429.0 47.3 381.8 349.6 342.1 6.5 1.0 32.2 91.6 89.6 8.41962 456.7 51.6 405.1 371.3 363.3 7.0 1.1 33.8 91.7 89.7 8.31963 479.6 54.6 425.1 391.8 382.7 7.9 1.2 33.3 92.2 90.0 7.81964 514.6 52.1 462.5 421.7 411.4 8.9 1.3 40.8 91.2 89.0 8.81965 555.7 57.7 498.1 455.1 443.8 9.9 1.4 43.0 91.4 89.1 8.61966 603.9 66.4 537.5 493.1 480.9 10.7 1.6 44.4 91.7 89.5 8.31967 648.3 73.0 575.3 520.9 507.8 11.1 2.0 54.4 90.5 88.3 9.51968 712.0 87.0 625.0 572.2 558.0 12.2 2.0 52.8 91.6 89.3 8.41969 778.5 104.5 674.0 621.4 605.2 14.0 2.2 52.5 92.2 89.8 7.81970 838.8 103.1 735.7 666.2 648.5 15.2 2.6 69.5 90.6 88.1 9.41971 903.5 101.7 801.8 721.2 701.9 16.6 2.8 80.6 89.9 87.5 10.11972 992.7 123.6 869.1 791.9 770.6 18.1 3.1 77.2 91.1 88.7 8.91973 1,110.7 132.4 978.3 875.6 852.4 19.8 3.4 102.7 89.5 87.1 10.51974 1,222.6 151.0 1,071.6 958.0 933.4 21.2 3.4 113.6 89.4 87.1 10.61975 1,335.0 147.6 1,187.4 1,061.9 1,034.4 23.7 3.8 125.6 89.4 87.1 10.61976 1,474.8 172.3 1,302.5 1,180.2 1,151.9 23.9 4.4 122.3 90.6 88.4 9.41977 1,633.2 197.5 1,435.7 1,310.4 1,278.6 27.0 4.8 125.3 91.3 89.1 8.71978 1,837.7 229.4 1,608.3 1,465.8 1,428.5 31.9 5.4 142.5 91.1 88.8 8.91979 2,062.2 268.7 1,793.5 1,634.4 1,592.2 36.2 5.9 159.1 91.1 88.8 8.91980 2,307.9 298.9 2,009.0 1,807.5 1,757.1 43.6 6.8 201.4 90.0 87.5 10.01981 2,591.3 345.2 2,246.1 2,001.8 1,941.1 49.3 11.4 244.3 89.1 86.4 10.91982 2,775.3 354.1 2,421.2 2,150.4 2,077.3 59.5 13.6 270.8 88.8 85.8 11.21983 2,960.7 352.3 2,608.4 2,374.8 2,290.6 69.2 15.0 233.6 91.0 87.8 9.01984 3,289.5 377.4 2,912.0 2,597.3 2,503.3 77.0 16.9 314.8 89.2 86.0 10.81985 3,526.7 417.4 3,109.3 2,829.3 2,720.3 90.4 18.6 280.0 91.0 87.5 9.01986 3,722.4 437.3 3,285.1 3,016.7 2,899.7 96.1 20.9 268.4 91.8 88.3 8.21987 3,947.4 489.1 3,458.3 3,216.9 3,100.2 93.6 23.1 241.4 93.0 89.6 7.01988 4,253.7 505.0 3,748.7 3,475.8 3,353.6 96.8 25.4 272.9 92.7 89.5 7.31989 4,587.8 566.1 4,021.7 3,734.5 3,598.5 108.2 27.8 287.1 92.9 89.5 7.11990 4,878.6 592.8 4,285.8 3,986.4 3,839.9 116.1 30.4 299.4 93.0 89.6 7.01991 5,051.0 586.7 4,464.3 4,140.1 3,986.1 118.5 35.6 324.2 92.7 89.3 7.31992 5,362.0 610.6 4,751.4 4,385.4 4,235.3 111.8 38.3 366.0 92.3 89.1 7.71993 5,558.5 646.6 4,911.9 4,627.9 4,477.9 107.3 42.7 284.0 94.2 91.2 5.81994 5,842.5 690.7 5,151.8 4,902.4 4,743.3 112.8 46.3 249.5 95.2 92.1 4.81995 6,152.3 744.1 5,408.2 5,157.3 4,975.8 132.7 48.9 250.9 95.4 92.0 4.61996 6,520.6 832.1 5,688.5 5,460.0 5,256.8 150.3 52.9 228.4 96.0 92.4 4.01997 6,915.1 926.3 5,988.8 5,770.5 5,547.4 163.9 59.2 218.3 96.4 92.6 3.61998 7,423.0 1,027.0 6,395.9 6,119.1 5,879.5 174.5 65.2 276.8 95.7 91.9 4.31999 7,802.4 1,107.5 6,695.0 6,536.4 6,282.5 181.0 73.0 158.6 97.6 93.8 2.42000 8,429.7 1,235.7 7,194.0 7,025.6 6,739.4 204.7 81.5 168.5 97.7 93.7 2.32001 8,724.1 1,237.3 7,486.8 7,354.5 7,055.0 212.2 87.2 132.3 98.2 94.2 1.82002 8,881.9 1,051.8 7,830.1 7,645.3 7,350.7 196.4 98.2 184.7 97.6 93.9 2.42003 9,163.6 1,001.1 8,162.5 7,987.7 7,703.6 182.5 101.5 174.9 97.9 94.4 2.12004 9,727.2 1,046.3 8,680.9 8,499.2 8,195.9 191.3 112.1 181.7 97.9 94.4 2.12005 10,301.1 1,209.1 9,092.0 9,047.4 8,707.8 217.7 121.8 44.6 99.5 95.8 .52006 10,983.4 1,354.3 9,629.1 9,590.3 9,224.5 238.0 127.8 38.8 99.6 95.8 .42004: I 9,482.8 1,008.1 8,474.7 8,299.5 8,010.1 180.4 109.1 175.1 97.9 94.5 2.1II 9,629.6 1,024.5 8,605.1 8,432.9 8,135.0 186.1 111.8 172.2 98.0 94.5 2.0III 9,770.9 1,062.1 8,708.9 8,553.7 8,245.1 195.0 113.6 155.2 98.2 94.7 1.8IV 10,025.5 1,090.7 8,934.8 8,710.6 8,393.3 203.5 113.8 224.2 97.5 93.9 2.52005: I 10,074.1 1,166.4 8,907.7 8,819.0 8,488.8 208.3 122.0 88.7 99.0 95.3 1.0II 10,234.1 1,195.5 9,038.6 8,970.8 8,632.6 217.5 120.6 67.8 99.2 95.5 .8III 10,328.6 1,223.5 9,105.1 9,153.9 8,810.5 222.4 121.0 –48.8 100.5 96.8 –.5IV 10,567.4 1,251.0 9,316.4 9,245.7 8,899.3 222.6 123.7 70.8 99.2 95.5 .82006: I 10,787.1 1,318.6 9,468.5 9,384.0 9,034.7 227.1 122.2 84.5 99.1 95.4 .9II 10,915.5 1,342.6 9,572.9 9,542.9 9,183.9 231.0 128.0 30.0 99.7 95.9 .3III 11,030.9 1,355.2 9,675.8 9,677.1 9,305.7 242.3 129.1 –1.4 100.0 96.2 .0IV 11,200.2 1,401.0 9,799.2 9,757.2 9,373.7 251.6 131.8 42.0 99.6 95.7 .42007: I 11,469.2 1,454.7 10,014.5 9,917.5 9,540.5 243.3 133.7 97.0 99.0 95.3 1.0II 11,577.3 1,477.6 10,099.7 10,069.2 9,674.0 259.5 135.7 30.5 99.7 95.8 .3III 11,746.7 1,489.2 10,257.5 10,200.9 9,785.7 275.8 139.3 56.7 99.4 95.4 .61 Consists of nonmortgage interest paid by households.2 Percents based on data in millions of dollars.Source: Department of Commerce (Bureau of Economic Analysis).262 | Economic Report of the <strong>President</strong>
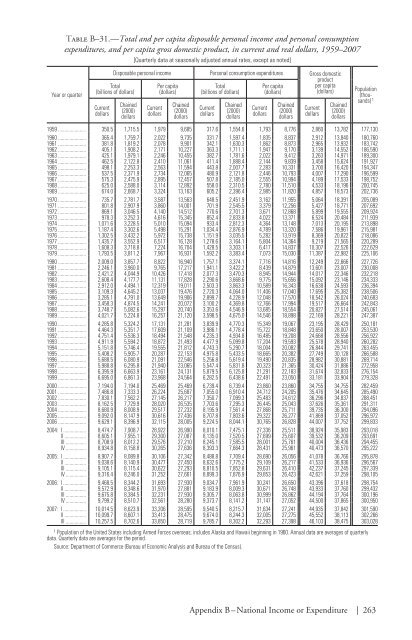
Table B–31.—Total and per capita disposable personal income and personal consumptionexpenditures, and per capita gross domestic product, in current and real dollars, 1959–2007Year or quarter[Quarterly data at seasonally adjusted annual rates, except as noted]Disposable personal income Personal consumption expenditures Gross domesticproductTotalPer capitaTotalPer capitaper capita(billions of dollars)(dollars)(billions of dollars)(dollars)(dollars)CurrentdollarsChained(2000)dollarsCurrentdollarsChained(2000)dollarsCurrentdollarsChained(2000)dollarsCurrentdollarsChained(2000)dollarsCurrentdollarsChained(2000)dollarsPopulation(thousands)11959 350.5 1,715.5 1,979 9,685 317.6 1,554.6 1,793 8,776 2,860 13,782 177,1301960 365.4 1,759.7 2,022 9,735 331.7 1,597.4 1,835 8,837 2,912 13,840 180,7601961 381.8 1,819.2 2,078 9,901 342.1 1,630.3 1,862 8,873 2,965 13,932 183,7421962 405.1 1,908.2 2,171 10,227 363.3 1,711.1 1,947 9,170 3,139 14,552 186,5901963 425.1 1,979.1 2,246 10,455 382.7 1,781.6 2,022 9,412 3,263 14,971 189,3001964 462.5 2,122.8 2,410 11,061 411.4 1,888.4 2,144 9,839 3,458 15,624 191,9271965 498.1 2,253.3 2,563 11,594 443.8 2,007.7 2,283 10,331 3,700 16,420 194,3471966 537.5 2,371.9 2,734 12,065 480.9 2,121.8 2,446 10,793 4,007 17,290 196,5991967 575.3 2,475.9 2,895 12,457 507.8 2,185.0 2,555 10,994 4,189 17,533 198,7521968 625.0 2,588.0 3,114 12,892 558.0 2,310.5 2,780 11,510 4,533 18,196 200,7451969 674.0 2,668.7 3,324 13,163 605.2 2,396.4 2,985 11,820 4,857 18,573 202,7361970 735.7 2,781.7 3,587 13,563 648.5 2,451.9 3,162 11,955 5,064 18,391 205,0891971 801.8 2,907.9 3,860 14,001 701.9 2,545.5 3,379 12,256 5,427 18,771 207,6921972 869.1 3,046.5 4,140 14,512 770.6 2,701.3 3,671 12,868 5,899 19,555 209,9241973 978.3 3,252.3 4,616 15,345 852.4 2,833.8 4,022 13,371 6,524 20,484 211,9391974 1,071.6 3,228.5 5,010 15,094 933.4 2,812.3 4,364 13,148 7,013 20,195 213,8981975 1,187.4 3,302.6 5,498 15,291 1,034.4 2,876.9 4,789 13,320 7,586 19,961 215,9811976 1,302.5 3,432.2 5,972 15,738 1,151.9 3,035.5 5,282 13,919 8,369 20,822 218,0861977 1,435.7 3,552.9 6,517 16,128 1,278.6 3,164.1 5,804 14,364 9,219 21,565 220,2891978 1,608.3 3,718.8 7,224 16,704 1,428.5 3,303.1 6,417 14,837 10,307 22,526 222,6291979 1,793.5 3,811.2 7,967 16,931 1,592.2 3,383.4 7,073 15,030 11,387 22,982 225,1061980 2,009.0 3,857.7 8,822 16,940 1,757.1 3,374.1 7,716 14,816 12,249 22,666 227,7261981 2,246.1 3,960.0 9,765 17,217 1,941.1 3,422.2 8,439 14,879 13,601 23,007 230,0081982 2,421.2 4,044.9 10,426 17,418 2,077.3 3,470.3 8,945 14,944 14,017 22,346 232,2181983 2,608.4 4,177.7 11,131 17,828 2,290.6 3,668.6 9,775 15,656 15,092 23,146 234,3331984 2,912.0 4,494.1 12,319 19,011 2,503.3 3,863.3 10,589 16,343 16,638 24,593 236,3941985 3,109.3 4,645.2 13,037 19,476 2,720.3 4,064.0 11,406 17,040 17,695 25,382 238,5061986 3,285.1 4,791.0 13,649 19,906 2,899.7 4,228.9 12,048 17,570 18,542 26,024 240,6831987 3,458.3 4,874.5 14,241 20,072 3,100.2 4,369.8 12,766 17,994 19,517 26,664 242,8431988 3,748.7 5,082.6 15,297 20,740 3,353.6 4,546.9 13,685 18,554 20,827 27,514 245,0611989 4,021.7 5,224.8 16,257 21,120 3,598.5 4,675.0 14,546 18,898 22,169 28,221 247,3871990 4,285.8 5,324.2 17,131 21,281 3,839.9 4,770.3 15,349 19,067 23,195 28,429 250,1811991 4,464.3 5,351.7 17,609 21,109 3,986.1 4,778.4 15,722 18,848 23,650 28,007 253,5301992 4,751.4 5,536.3 18,494 21,548 4,235.3 4,934.8 16,485 19,208 24,668 28,556 256,9221993 4,911.9 5,594.2 18,872 21,493 4,477.9 5,099.8 17,204 19,593 25,578 28,940 260,2821994 5,151.8 5,746.4 19,555 21,812 4,743.3 5,290.7 18,004 20,082 26,844 29,741 263,4551995 5,408.2 5,905.7 20,287 22,153 4,975.8 5,433.5 18,665 20,382 27,749 30,128 266,5881996 5,688.5 6,080.9 21,091 22,546 5,256.8 5,619.4 19,490 20,835 28,982 30,881 269,7141997 5,988.8 6,295.8 21,940 23,065 5,547.4 5,831.8 20,323 21,365 30,424 31,886 272,9581998 6,395.9 6,663.9 23,161 24,131 5,879.5 6,125.8 21,291 22,183 31,674 32,833 276,1541999 6,695.0 6,861.3 23,968 24,564 6,282.5 6,438.6 22,491 23,050 33,181 33,904 279,3282000 7,194.0 7,194.0 25,469 25,469 6,739.4 6,739.4 23,860 23,860 34,755 34,755 282,4592001 7,486.8 7,333.3 26,224 25,687 7,055.0 6,910.4 24,712 24,205 35,476 34,645 285,4902002 7,830.1 7,562.2 27,145 26,217 7,350.7 7,099.3 25,483 24,612 36,296 34,837 288,4512003 8,162.5 7,729.9 28,020 26,535 7,703.6 7,295.3 26,445 25,043 37,626 35,361 291,3112004 8,680.9 8,008.9 29,517 27,232 8,195.9 7,561.4 27,868 25,711 39,735 36,300 294,0962005 9,092.0 8,147.9 30,616 27,436 8,707.8 7,803.6 29,322 26,277 41,869 37,052 296,9722006 9,629.1 8,396.9 32,115 28,005 9,224.5 8,044.1 30,765 26,828 44,007 37,752 299,8332004: I 8,474.7 7,908.7 28,922 26,990 8,010.1 7,475.1 27,336 25,511 38,924 35,983 293,018II 8,605.1 7,955.1 29,300 27,087 8,135.0 7,520.5 27,699 25,607 39,532 36,209 293,691III 8,708.9 8,012.2 29,576 27,210 8,245.1 7,585.5 28,001 25,761 40,004 36,436 294,455IV 8,934.8 8,158.8 30,265 27,636 8,393.3 7,664.3 28,431 25,961 40,473 36,570 295,2222005: I 8,907.7 8,089.8 30,106 27,342 8,488.8 7,709.4 28,690 26,056 41,078 36,766 295,878II 9,038.6 8,140.9 30,477 27,450 8,632.6 7,775.2 29,109 26,217 41,533 36,936 296,567III 9,105.1 8,115.4 30,622 27,293 8,810.5 7,852.8 29,631 26,410 42,237 37,245 297,339IV 9,316.4 8,246.0 31,252 27,661 8,899.3 7,876.9 29,853 26,423 42,621 37,259 298,1052006: I 9,468.5 8,344.2 31,693 27,930 9,034.7 7,961.9 30,241 26,650 43,396 37,618 298,754II 9,572.9 8,348.6 31,970 27,881 9,183.9 8,009.3 30,671 26,748 43,933 37,760 299,432III 9,675.8 8,384.5 32,231 27,930 9,305.7 8,063.8 30,999 26,862 44,194 37,764 300,196IV 9,799.2 8,510.7 32,561 28,280 9,373.7 8,141.2 31,147 27,052 44,500 37,865 300,9502007: I 10,014.5 8,623.9 33,206 28,595 9,540.5 8,215.7 31,634 27,241 44,935 37,842 301,590II 10,099.7 8,607.1 33,413 28,475 9,674.0 8,244.3 32,005 27,275 45,552 38,113 302,266III 10,257.5 8,702.6 33,850 28,719 9,785.7 8,302.2 32,293 27,398 46,103 38,475 303,0281 Population of the United States including Armed Forces overseas; includes Alaska and Hawaii beginning in 1960. Annual data are averages of quarterlydata. Quarterly data are averages for the period.Source: Department of Commerce (Bureau of Economic Analysis and Bureau of the Census).Appendix B – National Income or Expenditure | 263
- Page 1 and 2:
EconomicReportof thePresidentTransm
- Page 4 and 5:
C O N T E N T SPageECONOMIC REPORT
- Page 7 and 8:
ECONOMIC REPORT OF THE PRESIDENTTo
- Page 9:
$2 billion to a new international c
- Page 13:
LETTER OF TRANSMITTALCouncil of Eco
- Page 16 and 17:
chapter 3. the causes and consequen
- Page 18 and 19:
appendixesA. Report to the Presiden
- Page 20 and 21:
2-5. Mortgage Lending Today........
- Page 22 and 23:
Chapter 1: The Year in Reviewand th
- Page 24 and 25:
Chapter 3: The Causes and Consequen
- Page 26 and 27:
• Tax reductions in 2001 and 2003
- Page 28 and 29:
• More effective statistical use
- Page 30 and 31:
• Real GDP posted solid 2.5 perce
- Page 32 and 33:
elative to non-energy prices, while
- Page 34 and 35:
nonconforming mortgages in 2007. In
- Page 36 and 37:
In addition to incomes and mortgage
- Page 38 and 39:
Business InventoriesInventory inves
- Page 40 and 41:
Indeed, the growth in foreign econo
- Page 42 and 43:
During the 12 months of 2007, the u
- Page 44 and 45:
output measures announced in the an
- Page 46 and 47:
and government purchases. In contra
- Page 48 and 49:
Table 1-1.—Administration Economi
- Page 50 and 51:
Box 1-3 — continuedParticipation
- Page 52 and 53:
finalized), below its 1963-2006 ave
- Page 55 and 56:
C H A P T E R 2Credit and Housing M
- Page 57 and 58:
lends a debtor money today, which t
- Page 59 and 60:
Box 2-1 — continuedPrime loan: Lo
- Page 61 and 62:
Box 2-2 — continuedNRSROs. Critic
- Page 63 and 64:
Box 2-3 — continuedMortgage defau
- Page 65 and 66:
Box 2-3 — continuedmortgage defau
- Page 67 and 68:
Corporate bond yields also rose rel
- Page 69 and 70:
conduits in that SIVs have less acc
- Page 71 and 72:
International ImplicationsA notable
- Page 73 and 74:
come together to create a coordinat
- Page 75 and 76:
home is forgiven, that portion is t
- Page 77 and 78:
alternatives offered in the convent
- Page 79 and 80:
to such a change in wealth, which a
- Page 81:
lending. FHA Modernization will enc
- Page 84 and 85:
Economists often call attention to
- Page 86 and 87:
Box 3-1: Trade in ServicesDiscussio
- Page 88 and 89:
Box 3-2: The Current Account Defici
- Page 90 and 91:
Growth in Domestic ProductionA seco
- Page 92 and 93:
Exports and Foreign Direct Investme
- Page 94 and 95:
in CFIUS’s role in protecting nat
- Page 96 and 97:
these goods than if they were produ
- Page 98 and 99:
y import competition are electrical
- Page 101 and 102:
C H A P T E R 4The Importance of He
- Page 103 and 104:
Box 4-1: Health Effects on Job Prod
- Page 105 and 106:
health care spending growth. Rising
- Page 107 and 108:
While the study focused on spending
- Page 109 and 110:
Box 4-2 — continuedand without pr
- Page 111 and 112:
effective price of zero. Even if a
- Page 113 and 114:
deduction for health insurance to a
- Page 115 and 116:
To reduce the extent to which high-
- Page 117 and 118:
Administration supports broad adopt
- Page 119 and 120:
C H A P T E R 5Tax PolicySocieties
- Page 121 and 122:
in 2000. Tax revenues increased str
- Page 123 and 124:
Alternative Minimum TaxPrior to 196
- Page 125 and 126:
The Impact of Recent Tax Reductions
- Page 127 and 128:
35 percent marginal tax rate on the
- Page 129 and 130:
C corporations fall under the corpo
- Page 131 and 132:
Significance of Tax Cuts to Individ
- Page 133 and 134:
Box 5-1: Marriage Penalty BasicsIt
- Page 135 and 136:
The Structure of Business TaxesDesp
- Page 137 and 138:
investments are made. A more modest
- Page 139 and 140:
able to defer $35 of tax liability
- Page 141 and 142:
C H A P T E R 6The Nation’s Infra
- Page 143 and 144:
A monopolistic bridge owner may cho
- Page 145 and 146:
etween places to accommodating grow
- Page 147 and 148:
the same time. At hours when many d
- Page 149 and 150:
BridgesOn August 1, 2007, the I-35W
- Page 151 and 152:
where shippers have an alternative
- Page 153 and 154:
Freight shipments into and out of t
- Page 155 and 156:
Box 6-2: Delays at New York City Ai
- Page 157 and 158:
uilt, the marginal cost of transmis
- Page 159 and 160:
access was in mobile wireless conne
- Page 161 and 162:
Infrastructure PolicyThough the U.S
- Page 163 and 164:
could shorten the wait by adding an
- Page 165 and 166:
In 2005, the Federal Aviation Admin
- Page 167 and 168:
C H A P T E R 7Searching for Altern
- Page 169 and 170:
The first U.S. oil well was drilled
- Page 171 and 172:
Most of the oil consumed in the Uni
- Page 173 and 174:
Also, depending on the fuel and tec
- Page 175 and 176:
Table 7-1. —Estimated Average Lev
- Page 177 and 178:
Nevada. The facility is expected to
- Page 179 and 180:
Wind PowerWind power supplies about
- Page 181 and 182:
amounts of electricity, it could be
- Page 183 and 184:
years, as corn-based ethanol produc
- Page 185 and 186:
the power, range, and convenient fu
- Page 187 and 188:
other petroleum products is project
- Page 189 and 190:
To help meet the growing demand for
- Page 191 and 192:
C H A P T E R 8Improving Economic S
- Page 193 and 194:
The second largest Federal statisti
- Page 195 and 196:
As shown in Chart 8-3, spending on
- Page 197 and 198:
Monetary and fiscal policymakers al
- Page 199 and 200:
service-sector output much more fre
- Page 201 and 202:
Box 8-1: How to Reverse a Decline i
- Page 203 and 204:
Information Protection and Statisti
- Page 205 and 206:
forward instead of the growth rate
- Page 207:
Appendix AREPORT TO THE PRESIDENT O
- Page 210 and 211:
Council Members and Their Dates of
- Page 213 and 214:
Report to the President on theActiv
- Page 215 and 216: The Council also prepared in-depth
- Page 217 and 218: The Staff of the Council of Economi
- Page 219: Jane Tufts, Bruce Kaplan, and Anna
- Page 223 and 224: C O N T E N T SNational Income or E
- Page 225 and 226: Prices—ContinuedPageB-63. Changes
- Page 227 and 228: General NotesDetail in these tables
- Page 229 and 230: Table B-1.—Gross domestic product
- Page 231 and 232: Table B-2.—Real gross domestic pr
- Page 233 and 234: Table B-4.—Percent changes in rea
- Page 235 and 236: Table B-5.—Contributions to perce
- Page 237 and 238: Table B-6.—Chain-type quantity in
- Page 239 and 240: Table B-7.—Chain-type price index
- Page 241 and 242: Table B-9.—Real gross domestic pr
- Page 243 and 244: Table B-11.—Real gross value adde
- Page 245 and 246: Table B-12.—Gross domestic produc
- Page 247 and 248: Table B-13.—Real gross domestic p
- Page 249 and 250: Table B-15.—Gross value added and
- Page 251 and 252: Table B-17.—Real personal consump
- Page 253 and 254: Table B-19.—Real private fixed in
- Page 255 and 256: Table B-21.—Real government consu
- Page 257 and 258: QuarterTable B-23.—Real private i
- Page 259 and 260: Table B-25.—Real exports and impo
- Page 261 and 262: Table B-27.—Relation of national
- Page 263 and 264: Table B-28.—National income by ty
- Page 265: Table B-29.—Sources of personal i
- Page 269 and 270: Table B-32.—Gross saving and inve
- Page 271 and 272: Population, Employment, Wages, and
- Page 273 and 274: Table B-35.—Civilian population a
- Page 275 and 276: Table B-37.—Civilian employment b
- Page 277 and 278: Table B-39.—Civilian labor force
- Page 279 and 280: Table B-41.—Civilian employment/p
- Page 281 and 282: Table B-43.—Civilian unemployment
- Page 283 and 284: Table B-45.—Unemployment insuranc
- Page 285 and 286: Table B-46.—Employees on nonagric
- Page 287 and 288: Table B-48.—Employment cost index
- Page 289 and 290: Table B-50.—Changes in productivi
- Page 291 and 292: Table B-52.—Industrial production
- Page 293 and 294: Table B-54.—Capacity utilization
- Page 295 and 296: Table B-56.—New private housing u
- Page 297 and 298: Table B-58.—Manufacturers’ ship
- Page 299 and 300: PricesTable B-60.—Consumer price
- Page 301 and 302: Table B-61.—Consumer price indexe
- Page 303 and 304: Table B-63.—Changes in special co
- Page 305 and 306: Year or monthTable B-65.—Producer
- Page 307 and 308: Table B-66.—Producer price indexe
- Page 309 and 310: Table B-67.—Producer price indexe
- Page 311 and 312: Year and monthMoney Stock, Credit,
- Page 313 and 314: Table B-70.—Components of money s
- Page 315 and 316: Table B-72.—Bank credit at all co
- Page 317 and 318:
Table B-73.—Bond yields and inter
- Page 319 and 320:
Table B-74.—Credit market borrowi
- Page 321 and 322:
Table B-76.—Mortgage debt outstan
- Page 323 and 324:
Government FinanceTable B-78.—Fed
- Page 325 and 326:
Table B-80.—Federal receipts and
- Page 327 and 328:
Table B-82.—Federal and State and
- Page 329 and 330:
Table B-84.—Federal Government cu
- Page 331 and 332:
Table B-86.—State and local gover
- Page 333 and 334:
Table B-88.—Maturity distribution
- Page 335 and 336:
Corporate Profits and FinanceTable
- Page 337 and 338:
Table B-92.—Corporate profits of
- Page 339 and 340:
Table B-94.—Relation of profits a
- Page 341 and 342:
Year or monthTable B-96.—Common s
- Page 343 and 344:
Table B-98.—Farm business balance
- Page 345 and 346:
YearTotalTable B-100.—Farm input
- Page 347 and 348:
Table B-102.—U.S. exports and imp
- Page 349 and 350:
Table B-103.—U.S. international t
- Page 351 and 352:
Table B-105.—U.S. international t
- Page 353 and 354:
Table B-107.—International invest
- Page 355 and 356:
Table B-109.—Civilian unemploymen
- Page 357 and 358:
Table B-111.—International reserv