Arquivo do Trabalho - IAG - USP
Arquivo do Trabalho - IAG - USP
Arquivo do Trabalho - IAG - USP

You also want an ePaper? Increase the reach of your titles
YUMPU automatically turns print PDFs into web optimized ePapers that Google loves.
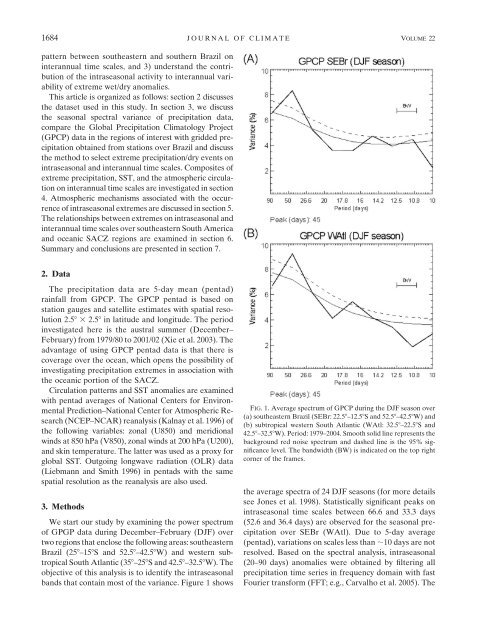
1684 JOURNAL OF CLIMATE VOLUME 22pattern between southeastern and southern Brazil oninterannual time scales, and 3) understand the contributionof the intraseasonal activity to interannual variabilityof extreme wet/dry anomalies.This article is organized as follows: section 2 discussesthe dataset used in this study. In section 3, we discussthe seasonal spectral variance of precipitation data,compare the Global Precipitation Climatology Project(GPCP) data in the regions of interest with gridded precipitationobtained from stations over Brazil and discussthe method to select extreme precipitation/dry events onintraseasonal and interannual time scales. Composites ofextreme precipitation, SST, and the atmospheric circulationon interannual time scales are investigated in section4. Atmospheric mechanisms associated with the occurrenceof intraseasonal extremes are discussed in section 5.The relationships between extremes on intraseasonal andinterannual time scales over southeastern South Americaand oceanic SACZ regions are examined in section 6.Summary and conclusions are presented in section 7.2. DataThe precipitation data are 5-day mean (pentad)rainfall from GPCP. The GPCP pentad is based onstation gauges and satellite estimates with spatial resolution2.58 32.58 in latitude and longitude. The periodinvestigated here is the austral summer (December–February) from 1979/80 to 2001/02 (Xie et al. 2003). Theadvantage of using GPCP pentad data is that there iscoverage over the ocean, which opens the possibility ofinvestigating precipitation extremes in association withthe oceanic portion of the SACZ.Circulation patterns and SST anomalies are examinedwith pentad averages of National Centers for EnvironmentalPrediction–National Center for Atmospheric Research(NCEP–NCAR) reanalysis (Kalnay et al. 1996) ofthe following variables: zonal (U850) and meridionalwinds at 850 hPa (V850), zonal winds at 200 hPa (U200),and skin temperature. The latter was used as a proxy forglobal SST. Outgoing longwave radiation (OLR) data(Liebmann and Smith 1996) in pentads with the samespatial resolution as the reanalysis are also used.3. MethodsWe start our study by examining the power spectrumof GPGP data during December–February (DJF) overtwo regions that enclose the following areas: southeasternBrazil (258–158S and 52.58–42.58W) and western subtropicalSouth Atlantic (358–258S and 42.58–32.58W). Theobjective of this analysis is to identify the intraseasonalbands that contain most of the variance. Figure 1 showsFIG. 1. Average spectrum of GPCP during the DJF season over(a) southeastern Brazil (SEBr: 22.58–12.58S and 52.58–42.58W) and(b) subtropical western South Atlantic (WAtl: 32.58–22.58S and42.58–32.58W). Period: 1979–2004. Smooth solid line represents thebackground red noise spectrum and dashed line is the 95% significancelevel. The bandwidth (BW) is indicated on the top rightcorner of the frames.the average spectra of 24 DJF seasons (for more detailssee Jones et al. 1998). Statistically significant peaks onintraseasonal time scales between 66.6 and 33.3 days(52.6 and 36.4 days) are observed for the seasonal precipitationover SEBr (WAtl). Due to 5-day average(pentad), variations on scales less than ;10 days are notresolved. Based on the spectral analysis, intraseasonal(20–90 days) anomalies were obtained by filtering allprecipitation time series in frequency <strong>do</strong>main with fastFourier transform (FFT; e.g., Carvalho et al. 2005). The