Association
Magnetic Oxide Heterostructures: EuO on Cubic Oxides ... - JuSER
Magnetic Oxide Heterostructures: EuO on Cubic Oxides ... - JuSER
- No tags were found...

Create successful ePaper yourself
Turn your PDF publications into a flip-book with our unique Google optimized e-Paper software.
90 5. Results II: EuO integration directly on silicon<br />
<br />
<br />
<br />
<br />
Eu 3+ 4f<br />
multiplet<br />
Eu 2+ 4f<br />
multiplet<br />
Eu 2+ 4f<br />
multiplet<br />
Eu 3+ 4f<br />
multiplet<br />
Eu 2+ 4f<br />
multiplet<br />
Eu 3+ 4f<br />
multiplet<br />
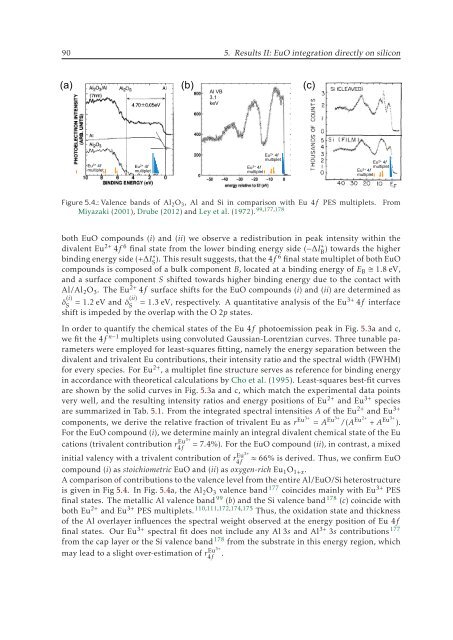
Figure 5.4.: Valence bands of Al 2 O 3 , Al and Si in comparison with Eu 4f PES multiplets.<br />
Miyazaki (2001), Drube (2012) and Ley et al. (1972). 99,177,178<br />
From<br />
both EuO compounds (i) and (ii) we observe a redistribution in peak intensity within the<br />
divalent Eu 2+ 4f 6 final state from the lower binding energy side (−ΔIB ∗ ) towards the higher<br />
binding energy side (+ΔIS ∗). This result suggests, that the 4f 6 final state multiplet of both EuO<br />
compounds is composed of a bulk component B, located at a binding energy of E B 1.8 eV,<br />
and a surface component S shifted towards higher binding energy due to the contact with<br />
Al/Al 2 O 3 . The Eu 2+ 4f surface shifts for the EuO compounds (i) and (ii) are determined as<br />
δ (i)<br />
S<br />
= 1.2 eV and δ(ii)<br />
S<br />
= 1.3 eV, respectively. A quantitative analysis of the Eu 3+ 4f interface<br />
shift is impeded by the overlap with the O 2p states.<br />
In order to quantify the chemical states of the Eu 4f photoemission peak in Fig. 5.3a and c,<br />
we fit the 4f n−1 multiplets using convoluted Gaussian-Lorentzian curves. Three tunable parameters<br />
were employed for least-squares fitting, namely the energy separation between the<br />
divalent and trivalent Eu contributions, their intensity ratio and the spectral width (FWHM)<br />
for every species. For Eu 2+ , a multiplet fine structure serves as reference for binding energy<br />
in accordance with theoretical calculations by Cho et al. (1995). Least-squares best-fit curves<br />
are shown by the solid curves in Fig. 5.3a and c, which match the experimental data points<br />
very well, and the resulting intensity ratios and energy positions of Eu 2+ and Eu 3+ species<br />
are summarized in Tab. 5.1. From the integrated spectral intensities A of the Eu 2+ and Eu 3+<br />
components, we derive the relative fraction of trivalent Eu as r Eu3+ = A Eu3+ / (A Eu2+ + A Eu3+ ).<br />
For the EuO compound (i), we determine mainly an integral divalent chemical state of the Eu<br />
cations (trivalent contribution r4f<br />
Eu3+ =7.4%). For the EuO compound (ii), in contrast, a mixed<br />
initial valency with a trivalent contribution of r4f<br />
Eu3+ ≈ 66% is derived. Thus, we confirm EuO<br />
compound (i) asstoichiometric EuO and (ii) asoxygen-rich Eu 1 O 1+x .<br />
A comparison of contributions to the valence level from the entire Al/EuO/Si heterostructure<br />
is given in Fig 5.4. In Fig. 5.4a, the Al 2 O 3 valence band 177 coincides mainly with Eu 3+ PES<br />
final states. The metallic Al valence band 99 (b) and the Si valence band 178 (c) coincide with<br />
both Eu 2+ and Eu 3+ PES multiplets. 110,111,172,174,175 Thus, the oxidation state and thickness<br />
of the Al overlayer influences the spectral weight observed at the energy position of Eu 4f<br />
final states. Our Eu 3+ spectral fit does not include any Al 3s and Al 3+ 3s contributions 177<br />
from the cap layer or the Si valence band 178 from the substrate in this energy region, which<br />
may lead to a slight over-estimation of r4f Eu3+ .