

Research Journal of Economics & Business Studies - RJEBS - The ...
Research Journal of Economics & Business Studies - RJEBS - The ...
Research Journal of Economics & Business Studies - RJEBS - The ...

You also want an ePaper? Increase the reach of your titles
YUMPU automatically turns print PDFs into web optimized ePapers that Google loves.
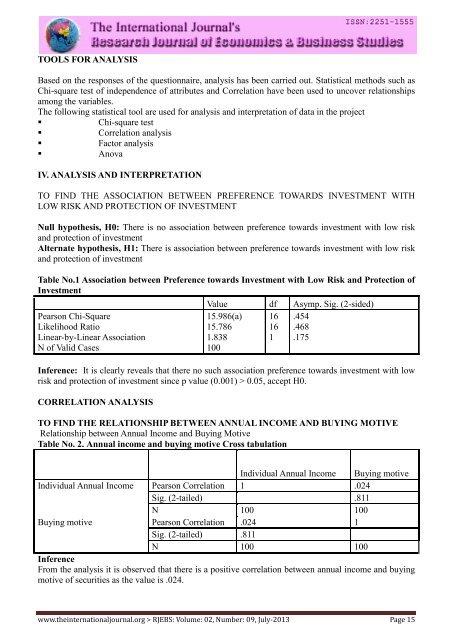
TOOLS FOR ANALYSIS<br />
Based on the responses <strong>of</strong> the questionnaire, analysis has been carried out. Statistical methods such as<br />
Chi-square test <strong>of</strong> independence <strong>of</strong> attributes and Correlation have been used to uncover relationships<br />
among the variables.<br />
<strong>The</strong> following statistical tool are used for analysis and interpretation <strong>of</strong> data in the project<br />
• Chi-square test<br />
• Correlation analysis<br />
• Factor analysis<br />
• Anova<br />
IV. ANALYSIS AND INTERPRETATION<br />
TO FIND THE ASSOCIATION BETWEEN PREFERENCE TOWARDS INVESTMENT WITH<br />
LOW RISK AND PROTECTION OF INVESTMENT<br />
Null hypothesis, H0: <strong>The</strong>re is no association between preference towards investment with low risk<br />
and protection <strong>of</strong> investment<br />
Alternate hypothesis, H1: <strong>The</strong>re is association between preference towards investment with low risk<br />
and protection <strong>of</strong> investment<br />
Table No.1 Association between Preference towards Investment with Low Risk and Protection <strong>of</strong><br />
Investment<br />
Value df Asymp. Sig. (2-sided)<br />
Pearson Chi-Square 15.986(a) 16 .454<br />
Likelihood Ratio 15.786 16 .468<br />
Linear-by-Linear Association 1.838 1 .175<br />
N <strong>of</strong> Valid Cases 100<br />
Inference: It is clearly reveals that there no such association preference towards investment with low<br />
risk and protection <strong>of</strong> investment since p value (0.001) > 0.05, accept H0.<br />
CORRELATION ANALYSIS<br />
TO FIND THE RELATIONSHIP BETWEEN ANNUAL INCOME AND BUYING MOTIVE<br />
Relationship between Annual Income and Buying Motive<br />
Table No. 2. Annual income and buying motive Cross tabulation<br />
Individual Annual Income Buying motive<br />
Individual Annual Income Pearson Correlation 1 .024<br />
Sig. (2-tailed) .811<br />
N 100 100<br />
Buying motive Pearson Correlation .024 1<br />
Sig. (2-tailed) .811<br />
N 100 100<br />
Inference<br />
From the analysis it is observed that there is a positive correlation between annual income and buying<br />
motive <strong>of</strong> securities as the value is .024.<br />
www.theinternationaljournal.org > <strong>RJEBS</strong>: Volume: 02, Number: 09, July-2013 Page 15


