Research Journal of Economics & Business Studies - RJEBS - The ...
Research Journal of Economics & Business Studies - RJEBS - The ...
Research Journal of Economics & Business Studies - RJEBS - The ...
Create successful ePaper yourself
Turn your PDF publications into a flip-book with our unique Google optimized e-Paper software.
Building on the Markowitz framework, Sharpe (1964), Lintner (1965) and Mossin (1966)<br />
independently developed what has come to be known as the capital asset pricing model (CAPM). <strong>The</strong><br />
model equation can be written as:<br />
(R j ) = R f + β j [R m - R f ] (1)<br />
Where, R f = 10 year treasury bill rate<br />
R m = Return from the market <strong>of</strong> individual security<br />
β j = Systematic risk /Un- diversifiable risk <strong>of</strong> individual security<br />
Section 4<br />
Analysis <strong>of</strong> Economic Value Added (EVA) <strong>of</strong> PSUs equity shares<br />
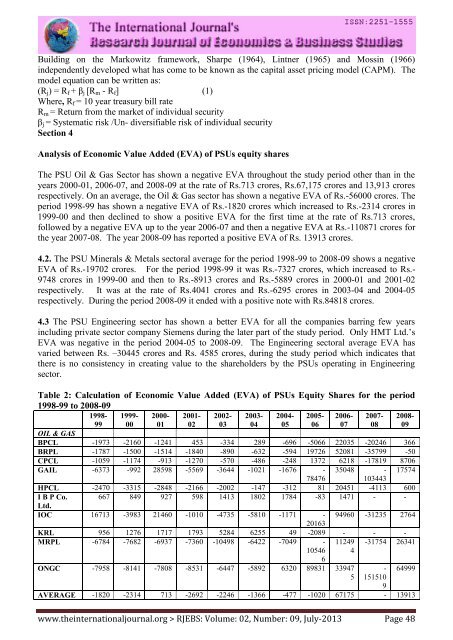
<strong>The</strong> PSU Oil & Gas Sector has shown a negative EVA throughout the study period other than in the<br />
years 2000-01, 2006-07, and 2008-09 at the rate <strong>of</strong> Rs.713 crores, Rs.67,175 crores and 13,913 crores<br />
respectively. On an average, the Oil & Gas sector has shown a negative EVA <strong>of</strong> Rs.-56000 crores. <strong>The</strong><br />
period 1998-99 has shown a negative EVA <strong>of</strong> Rs.-1820 crores which increased to Rs.-2314 crores in<br />
1999-00 and then declined to show a positive EVA for the first time at the rate <strong>of</strong> Rs.713 crores,<br />
followed by a negative EVA up to the year 2006-07 and then a negative EVA at Rs.-110871 crores for<br />
the year 2007-08. <strong>The</strong> year 2008-09 has reported a positive EVA <strong>of</strong> Rs. 13913 crores.<br />
4.2. <strong>The</strong> PSU Minerals & Metals sectoral average for the period 1998-99 to 2008-09 shows a negative<br />
EVA <strong>of</strong> Rs.-19702 crores. For the period 1998-99 it was Rs.-7327 crores, which increased to Rs.-<br />
9748 crores in 1999-00 and then to Rs.-8913 crores and Rs.-5889 crores in 2000-01 and 2001-02<br />
respectively. It was at the rate <strong>of</strong> Rs.4041 crores and Rs.-6295 crores in 2003-04 and 2004-05<br />
respectively. During the period 2008-09 it ended with a positive note with Rs.84818 crores.<br />
4.3 <strong>The</strong> PSU Engineering sector has shown a better EVA for all the companies barring few years<br />
including private sector company Siemens during the later part <strong>of</strong> the study period. Only HMT Ltd.’s<br />
EVA was negative in the period 2004-05 to 2008-09. <strong>The</strong> Engineering sectoral average EVA has<br />
varied between Rs. –30445 crores and Rs. 4585 crores, during the study period which indicates that<br />
there is no consistency in creating value to the shareholders by the PSUs operating in Engineering<br />
sector.<br />
Table 2: Calculation <strong>of</strong> Economic Value Added (EVA) <strong>of</strong> PSUs Equity Shares for the period<br />
1998-99 to 2008-09<br />
1998-<br />
1999-<br />
00<br />
2000-<br />
01<br />
2001-<br />
02<br />
2002-<br />
03<br />
99<br />
OIL & GAS<br />
BPCL -1973 -2160 -1241 453 -334 289 -696 -5066 22035 -20246 366<br />
BRPL -1787 -1500 -1514 -1840 -890 -632 -594 19726 52081 -35799 -50<br />
CPCL -1059 -1174 -913 -1270 -570 -486 -248 1372 6218 -17819 8706<br />
GAIL -6373 -992 28598 -5569 -3644 -1021 -1676 - 35048 - 17574<br />
78476<br />
103443<br />
HPCL -2470 -3315 -2848 -2166 -2002 -147 -312 81 20451 -4113 600<br />
I B P Co. 667 849 927 598 1413 1802 1784 -83 1471 - -<br />
Ltd.<br />
IOC 16713 -3983 21460 -1010 -4735 -5810 -1171 - 94960 -31235 2764<br />
20163<br />
KRL 956 1276 1717 1793 5284 6255 49 -2089 - - -<br />
MRPL -6784 -7682 -6937 -7360 -10498 -6422 -7049 -<br />
10546<br />
6<br />
11249<br />
4<br />
-31754 26341<br />
www.theinternationaljournal.org > <strong>RJEBS</strong>: Volume: 02, Number: 09, July-2013 Page 48<br />
2003-<br />
04<br />
2004-<br />
05<br />
2005-<br />
06<br />
2006-<br />
07<br />
ONGC -7958 -8141 -7808 -8531 -6447 -5892 6320 89831 33947<br />
5<br />
2007-<br />
08<br />
-<br />
151510<br />
9<br />
AVERAGE -1820 -2314 713 -2692 -2246 -1366 -477 -1020 67175 - 13913<br />
2008-<br />
09<br />
64999


