Research Journal of Economics & Business Studies - RJEBS - The ...
Research Journal of Economics & Business Studies - RJEBS - The ...
Research Journal of Economics & Business Studies - RJEBS - The ...
You also want an ePaper? Increase the reach of your titles
YUMPU automatically turns print PDFs into web optimized ePapers that Google loves.
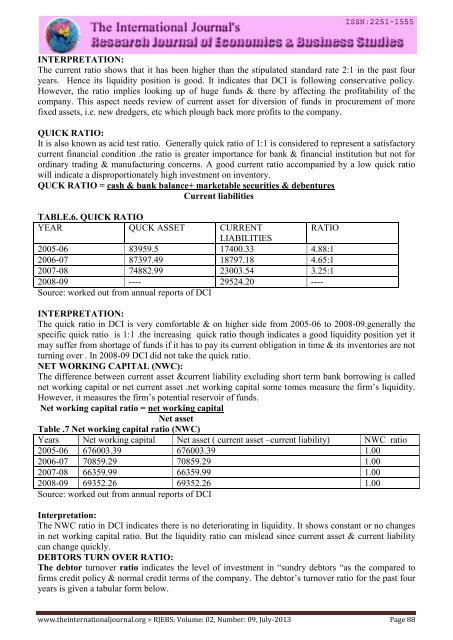
INTERPRETATION:<br />
<strong>The</strong> current ratio shows that it has been higher than the stipulated standard rate 2:1 in the past four<br />
years. Hence its liquidity position is good. It indicates that DCI is following conservative policy.<br />
However, the ratio implies looking up <strong>of</strong> huge funds & there by affecting the pr<strong>of</strong>itability <strong>of</strong> the<br />
company. This aspect needs review <strong>of</strong> current asset for diversion <strong>of</strong> funds in procurement <strong>of</strong> more<br />
fixed assets, i.e. new dredgers, etc which plough back more pr<strong>of</strong>its to the company.<br />
QUICK RATIO:<br />
It is also known as acid test ratio. Generally quick ratio <strong>of</strong> 1:1 is considered to represent a satisfactory<br />
current financial condition .the ratio is greater importance for bank & financial institution but not for<br />
ordinary trading & manufacturing concerns. A good current ratio accompanied by a low quick ratio<br />
will indicate a disproportionately high investment on inventory.<br />
QUCK RATIO = cash & bank balance+ marketable securities & debentures<br />
Current liabilities<br />
TABLE.6. QUICK RATIO<br />
YEAR QUCK ASSET CURRENT<br />
RATIO<br />
LIABILITIES<br />
2005-06 83959.5 17400.33 4.88:1<br />
2006-07 87397.49 18797.18 4.65:1<br />
2007-08 74882.99 23003.54 3.25:1<br />
2008-09 ---- 29524.20 ----<br />
Source: worked out from annual reports <strong>of</strong> DCI<br />
INTERPRETATION:<br />
<strong>The</strong> quick ratio in DCI is very comfortable & on higher side from 2005-06 to 2008-09.generally the<br />
specific quick ratio is 1:1 .the increasing quick ratio though indicates a good liquidity position yet it<br />
may suffer from shortage <strong>of</strong> funds if it has to pay its current obligation in time & its inventories are not<br />
turning over . In 2008-09 DCI did not take the quick ratio.<br />
NET WORKING CAPITAL (NWC):<br />
<strong>The</strong> difference between current asset ¤t liability excluding short term bank borrowing is called<br />
net working capital or net current asset .net working capital some tomes measure the firm’s liquidity.<br />
However, it measures the firm’s potential reservoir <strong>of</strong> funds.<br />
Net working capital ratio = net working capital<br />
Net asset<br />
Table .7 Net working capital ratio (NWC)<br />
Years Net working capital Net asset ( current asset –current liability) NWC ratio<br />
2005-06 676003.39 676003.39 1.00<br />
2006-07 70859.29 70859.29 1.00<br />
2007-08 66359.99 66359.99 1.00<br />
2008-09 69352.26 69352.26 1.00<br />
Source: worked out from annual reports <strong>of</strong> DCI<br />
Interpretation:<br />
<strong>The</strong> NWC ratio in DCI indicates there is no deteriorating in liquidity. It shows constant or no changes<br />
in net working capital ratio. But the liquidity ratio can mislead since current asset & current liability<br />
can change quickly.<br />
DEBTORS TURN OVER RATIO:<br />
<strong>The</strong> debtor turnover ratio indicates the level <strong>of</strong> investment in “sundry debtors “as the compared to<br />
firms credit policy & normal credit terms <strong>of</strong> the company. <strong>The</strong> debtor’s turnover ratio for the past four<br />
years is given a tabular form below.<br />
www.theinternationaljournal.org > <strong>RJEBS</strong>: Volume: 02, Number: 09, July-2013 Page 88


