

Research Journal of Economics & Business Studies - RJEBS - The ...
Research Journal of Economics & Business Studies - RJEBS - The ...
Research Journal of Economics & Business Studies - RJEBS - The ...

You also want an ePaper? Increase the reach of your titles
YUMPU automatically turns print PDFs into web optimized ePapers that Google loves.
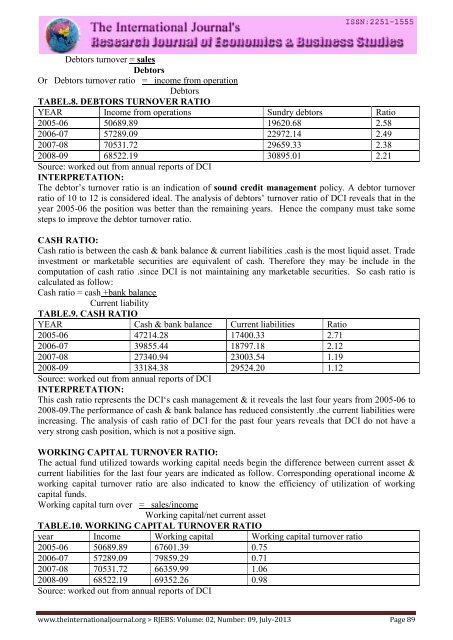
Debtors turnover = sales<br />
Debtors<br />
Or Debtors turnover ratio = income from operation<br />
Debtors<br />
TABEL.8. DEBTORS TURNOVER RATIO<br />
YEAR Income from operations Sundry debtors Ratio<br />
2005-06 50689.89 19620.68 2.58<br />
2006-07 57289.09 22972.14 2.49<br />
2007-08 70531.72 29659.33 2.38<br />
2008-09 68522.19 30895.01 2.21<br />
Source: worked out from annual reports <strong>of</strong> DCI<br />
INTERPRETATION:<br />
<strong>The</strong> debtor’s turnover ratio is an indication <strong>of</strong> sound credit management policy. A debtor turnover<br />
ratio <strong>of</strong> 10 to 12 is considered ideal. <strong>The</strong> analysis <strong>of</strong> debtors’ turnover ratio <strong>of</strong> DCI reveals that in the<br />
year 2005-06 the position was better than the remaining years. Hence the company must take some<br />
steps to improve the debtor turnover ratio.<br />
CASH RATIO:<br />
Cash ratio is between the cash & bank balance & current liabilities .cash is the most liquid asset. Trade<br />
investment or marketable securities are equivalent <strong>of</strong> cash. <strong>The</strong>refore they may be include in the<br />
computation <strong>of</strong> cash ratio .since DCI is not maintaining any marketable securities. So cash ratio is<br />
calculated as follow:<br />
Cash ratio = cash +bank balance<br />
Current liability<br />
TABLE.9. CASH RATIO<br />
YEAR Cash & bank balance Current liabilities Ratio<br />
2005-06 47214.28 17400.33 2.71<br />
2006-07 39855.44 18797.18 2.12<br />
2007-08 27340.94 23003.54 1.19<br />
2008-09 33184.38 29524.20 1.12<br />
Source: worked out from annual reports <strong>of</strong> DCI<br />
INTERPRETATION:<br />
This cash ratio represents the DCI‘s cash management & it reveals the last four years from 2005-06 to<br />
2008-09.<strong>The</strong> performance <strong>of</strong> cash & bank balance has reduced consistently .the current liabilities were<br />
increasing. <strong>The</strong> analysis <strong>of</strong> cash ratio <strong>of</strong> DCI for the past four years reveals that DCI do not have a<br />
very strong cash position, which is not a positive sign.<br />
WORKING CAPITAL TURNOVER RATIO:<br />
<strong>The</strong> actual fund utilized towards working capital needs begin the difference between current asset &<br />
current liabilities for the last four years are indicated as follow. Corresponding operational income &<br />
working capital turnover ratio are also indicated to know the efficiency <strong>of</strong> utilization <strong>of</strong> working<br />
capital funds.<br />
Working capital turn over = sales/income<br />
Working capital/net current asset<br />
TABLE.10. WORKING CAPITAL TURNOVER RATIO<br />
year Income Working capital Working capital turnover ratio<br />
2005-06 50689.89 67601.39 0.75<br />
2006-07 57289.09 79859.29 0.71<br />
2007-08 70531.72 66359.99 1.06<br />
2008-09 68522.19 69352.26 0.98<br />
Source: worked out from annual reports <strong>of</strong> DCI<br />
www.theinternationaljournal.org > <strong>RJEBS</strong>: Volume: 02, Number: 09, July-2013 Page 89


