

Research Journal of Economics & Business Studies - RJEBS - The ...
Research Journal of Economics & Business Studies - RJEBS - The ...
Research Journal of Economics & Business Studies - RJEBS - The ...

Create successful ePaper yourself
Turn your PDF publications into a flip-book with our unique Google optimized e-Paper software.
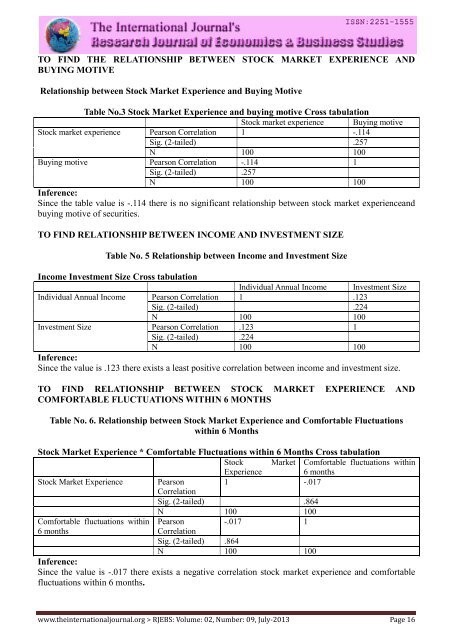
TO FIND THE RELATIONSHIP BETWEEN STOCK MARKET EXPERIENCE AND<br />
BUYING MOTIVE<br />
Relationship between Stock Market Experience and Buying Motive<br />
Table No.3 Stock Market Experience and buying motive Cross tabulation<br />
Stock market experience Buying motive<br />
Stock market experience Pearson Correlation 1 -.114<br />
Sig. (2-tailed) .257<br />
N 100 100<br />
Buying motive Pearson Correlation -.114 1<br />
Sig. (2-tailed) .257<br />
N 100 100<br />
Inference:<br />
Since the table value is -.114 there is no significant relationship between stock market experienceand<br />
buying motive <strong>of</strong> securities.<br />
TO FIND RELATIONSHIP BETWEEN INCOME AND INVESTMENT SIZE<br />
Table No. 5 Relationship between Income and Investment Size<br />
Income Investment Size Cross tabulation<br />
Individual Annual Income Investment Size<br />
Individual Annual Income Pearson Correlation 1 .123<br />
Sig. (2-tailed) .224<br />
N 100 100<br />
Investment Size Pearson Correlation .123 1<br />
Sig. (2-tailed) .224<br />
N 100 100<br />
Inference:<br />
Since the value is .123 there exists a least positive correlation between income and investment size.<br />
TO FIND RELATIONSHIP BETWEEN STOCK MARKET EXPERIENCE AND<br />
COMFORTABLE FLUCTUATIONS WITHIN 6 MONTHS<br />
Table No. 6. Relationship between Stock Market Experience and Comfortable Fluctuations<br />
within 6 Months<br />
Stock Market Experience * Comfortable Fluctuations within 6 Months Cross tabulation<br />
Stock Market Comfortable fluctuations within<br />
Experience 6 months<br />
Stock Market Experience Pearson 1 -.017<br />
Correlation<br />
Sig. (2-tailed) .864<br />
N 100 100<br />
Comfortable fluctuations within Pearson -.017 1<br />
6 months<br />
Correlation<br />
Sig. (2-tailed) .864<br />
N 100 100<br />
Inference:<br />
Since the value is -.017 there exists a negative correlation stock market experience and comfortable<br />
fluctuations within 6 months.<br />
www.theinternationaljournal.org > <strong>RJEBS</strong>: Volume: 02, Number: 09, July-2013 Page 16


