

Research Journal of Economics & Business Studies - RJEBS - The ...
Research Journal of Economics & Business Studies - RJEBS - The ...
Research Journal of Economics & Business Studies - RJEBS - The ...

Create successful ePaper yourself
Turn your PDF publications into a flip-book with our unique Google optimized e-Paper software.
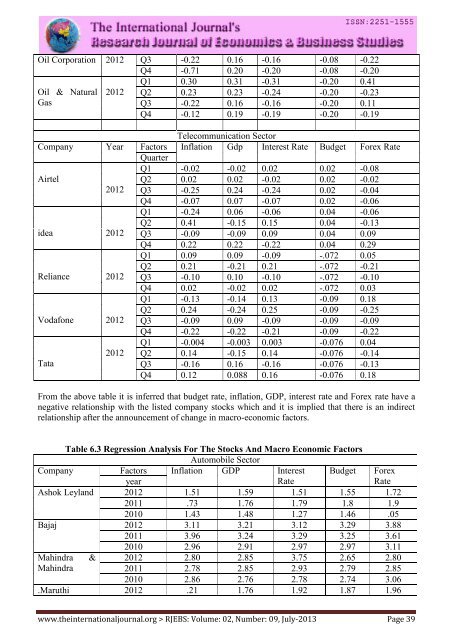
Oil Corporation 2012 Q3 -0.22 0.16 -0.16 -0.08 -0.22<br />
Q4 -0.71 0.20 -0.20 -0.08 -0.20<br />
Q1 0.30 0.31 -0.31 -0.20 0.41<br />
Oil & Natural 2012 Q2 0.23 0.23 -0.24 -0.20 -0.23<br />
Gas<br />
Q3 -0.22 0.16 -0.16 -0.20 0.11<br />
Q4 -0.12 0.19 -0.19 -0.20 -0.19<br />
Telecommunication Sector<br />
Company Year Factors Inflation Gdp Interest Rate Budget Forex Rate<br />
Quarter<br />
Q1 -0.02 -0.02 0.02 0.02 -0.08<br />
Airtel<br />
Q2 0.02 0.02 -0.02 0.02 -0.02<br />
2012 Q3 -0.25 0.24 -0.24 0.02 -0.04<br />
Q4 -0.07 0.07 -0.07 0.02 -0.06<br />
Q1 -0.24 0.06 -0.06 0.04 -0.06<br />
Q2 0.41 -0.15 0.15 0.04 -0.13<br />
idea 2012 Q3 -0.09 -0.09 0.09 0.04 0.09<br />
Q4 0.22 0.22 -0.22 0.04 0.29<br />
Q1 0.09 0.09 -0.09 -.072 0.05<br />
Q2 0.21 -0.21 0.21 -.072 -0.21<br />
Reliance 2012 Q3 -0.10 0.10 -0.10 -.072 -0.10<br />
Q4 0.02 -0.02 0.02 -.072 0.03<br />
Q1 -0.13 -0.14 0.13 -0.09 0.18<br />
Q2 0.24 -0.24 0.25 -0.09 -0.25<br />
Vodafone 2012 Q3 -0.09 0.09 -0.09 -0.09 -0.09<br />
Q4 -0.22 -0.22 -0.21 -0.09 -0.22<br />
Q1 -0.004 -0.003 0.003 -0.076 0.04<br />
2012 Q2 0.14 -0.15 0.14 -0.076 -0.14<br />
Tata<br />
Q3 -0.16 0.16 -0.16 -0.076 -0.13<br />
Q4 0.12 0.088 0.16 -0.076 0.18<br />
From the above table it is inferred that budget rate, inflation, GDP, interest rate and Forex rate have a<br />
negative relationship with the listed company stocks which and it is implied that there is an indirect<br />
relationship after the announcement <strong>of</strong> change in macro-economic factors.<br />
Table 6.3 Regression Analysis For <strong>The</strong> Stocks And Macro Economic Factors<br />
Automobile Sector<br />
Company Factors Inflation GDP Interest Budget Forex<br />
year<br />
Rate<br />
Rate<br />
Ashok Leyland 2012 1.51 1.59 1.51 1.55 1.72<br />
2011 .73 1.76 1.79 1.8 1.9<br />
2010 1.43 1.48 1.27 1.46 .05<br />
Bajaj 2012 3.11 3.21 3.12 3.29 3.88<br />
2011 3.96 3.24 3.29 3.25 3.61<br />
2010 2.96 2.91 2.97 2.97 3.11<br />
Mahindra & 2012 2.80 2.85 3.75 2.65 2.80<br />
Mahindra<br />
2011 2.78 2.85 2.93 2.79 2.85<br />
2010 2.86 2.76 2.78 2.74 3.06<br />
.Maruthi 2012 .21 1.76 1.92 1.87 1.96<br />
www.theinternationaljournal.org > <strong>RJEBS</strong>: Volume: 02, Number: 09, July-2013 Page 39


