Research Journal of Economics & Business Studies - RJEBS - The ...
Research Journal of Economics & Business Studies - RJEBS - The ...
Research Journal of Economics & Business Studies - RJEBS - The ...
You also want an ePaper? Increase the reach of your titles
YUMPU automatically turns print PDFs into web optimized ePapers that Google loves.
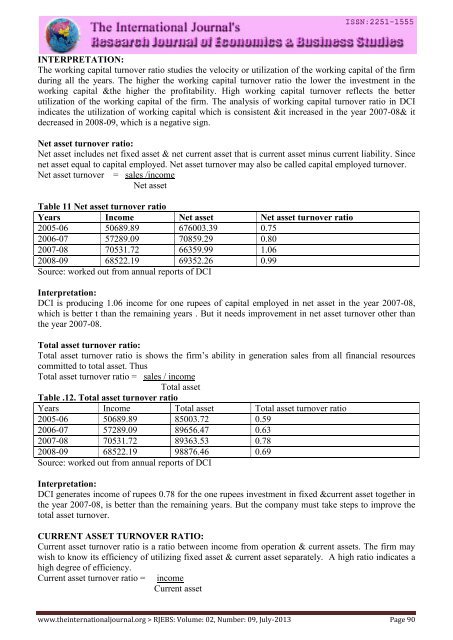
INTERPRETATION:<br />
<strong>The</strong> working capital turnover ratio studies the velocity or utilization <strong>of</strong> the working capital <strong>of</strong> the firm<br />
during all the years. <strong>The</strong> higher the working capital turnover ratio the lower the investment in the<br />
working capital &the higher the pr<strong>of</strong>itability. High working capital turnover reflects the better<br />
utilization <strong>of</strong> the working capital <strong>of</strong> the firm. <strong>The</strong> analysis <strong>of</strong> working capital turnover ratio in DCI<br />
indicates the utilization <strong>of</strong> working capital which is consistent &it increased in the year 2007-08& it<br />
decreased in 2008-09, which is a negative sign.<br />
Net asset turnover ratio:<br />
Net asset includes net fixed asset & net current asset that is current asset minus current liability. Since<br />
net asset equal to capital employed. Net asset turnover may also be called capital employed turnover.<br />
Net asset turnover = sales /income<br />
Net asset<br />
Table 11 Net asset turnover ratio<br />
Years Income Net asset Net asset turnover ratio<br />
2005-06 50689.89 676003.39 0.75<br />
2006-07 57289.09 70859.29 0.80<br />
2007-08 70531.72 66359.99 1.06<br />
2008-09 68522.19 69352.26 0.99<br />
Source: worked out from annual reports <strong>of</strong> DCI<br />
Interpretation:<br />
DCI is producing 1.06 income for one rupees <strong>of</strong> capital employed in net asset in the year 2007-08,<br />
which is better t than the remaining years . But it needs improvement in net asset turnover other than<br />
the year 2007-08.<br />
Total asset turnover ratio:<br />
Total asset turnover ratio is shows the firm’s ability in generation sales from all financial resources<br />
committed to total asset. Thus<br />
Total asset turnover ratio = sales / income<br />
Total asset<br />
Table .12. Total asset turnover ratio<br />
Years Income Total asset Total asset turnover ratio<br />
2005-06 50689.89 85003.72 0.59<br />
2006-07 57289.09 89656.47 0.63<br />
2007-08 70531.72 89363.53 0.78<br />
2008-09 68522.19 98876.46 0.69<br />
Source: worked out from annual reports <strong>of</strong> DCI<br />
Interpretation:<br />
DCI generates income <strong>of</strong> rupees 0.78 for the one rupees investment in fixed ¤t asset together in<br />
the year 2007-08, is better than the remaining years. But the company must take steps to improve the<br />
total asset turnover.<br />
CURRENT ASSET TURNOVER RATIO:<br />
Current asset turnover ratio is a ratio between income from operation & current assets. <strong>The</strong> firm may<br />
wish to know its efficiency <strong>of</strong> utilizing fixed asset & current asset separately. A high ratio indicates a<br />
high degree <strong>of</strong> efficiency.<br />
Current asset turnover ratio =<br />
income<br />
Current asset<br />
www.theinternationaljournal.org > <strong>RJEBS</strong>: Volume: 02, Number: 09, July-2013 Page 90


