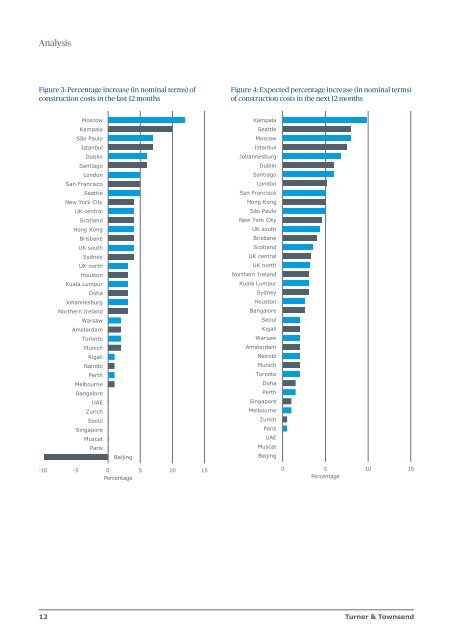
Analysis Figure 3: Percentage increase (in nominal terms) of <strong>construction</strong> costs in the last 12 months Figure 4: Expected percentage increase (in nominal terms) of <strong>construction</strong> costs in the next 12 months Moscow Kampala São Paulo Istanbul Dublin Santiago London San Francisco Seattle New York City UK central Scotland Hong Kong Brisbane UK south Sydney UK north Houston Kuala Lumpur Doha Johannesburg Northern Ireland Warsaw Amsterdam Toronto Munich Kigali Nairobi Perth Melbourne Bangalore UAE Zurich Seoul Singapore Muscat Paris Beijiing Beijing Kampala Seattle Moscow Istanbul Johannesburg Dublin Santiago London San Francisco Hong Kong São Paulo New York City UK south Brisbane Scotland UK central UK north Northern Ireland Kuala Lumpur Sydney Houston Bangalore Seoul Kigali Warsaw Amsterdam Nairobi Munich Toronto Doha Perth Singapore Melbourne Zurich Paris UAE Muscat Beijing -10 -5 0 Percentage 5 10 15 0 5 10 15 Percentage 12 Turner & Townsend
Analysis Over the long term, <strong>construction</strong> <strong>market</strong>s follow a boom and bust lifecycle. Tracking this cycle is key for real estate investors and developers who need to ensure they enter and exit <strong>market</strong>s at the right time. Counting projects and analysing approval and commencement data allows us to map future activity and help clients make informed decisions about viability and likely cost escalation for their projects around the world. Risers and fallers This year’s <strong>survey</strong> shows only nine <strong>market</strong>s are expected to grow warmer over <strong>2016</strong>, while ten <strong>market</strong>s are estimated to cool (see figure 2). This compares to 17 <strong>market</strong>s that were predicted to warm up and eight forecast to cool down in our 2015 <strong>survey</strong>. The <strong>market</strong>s expected to cool in <strong>2016</strong> are mostly those with a heavy dependence on the natural resources sector, such as Johannesburg, Muscat, Perth, São Paulo, Santiago or those with strong connections to China’s economy, such as Hong Kong, Singapore and Kuala Lumpur. The UK’s central and north regions, as well as London and Northern Ireland are among those <strong>market</strong>s forecast to heat up. Similar drivers place Amsterdam, Dublin and San Francisco in this category, with warming led by developer-led <strong>construction</strong> booms and rising house prices. In Kampala and Kigali, demand for residential and retail <strong>construction</strong> is growing and gradually their <strong>construction</strong> sectors are responding, often driven by overseas investors. For example, global retailers are keen to capitalise on growing middle-class consumer demand and see East Africa as a good opportunity. This has pushed these two <strong>market</strong>s firmly into warming. Overall, our <strong>survey</strong> has found that <strong>construction</strong> costs have increased over the last 12 months (see figure 3). On average, they are set to rise slightly in the next 12 months, increasing to 3.4 percent from 2.9 percent for the year to January <strong>2016</strong> (see figure 4). Construction cost data For building costs in more depth, the data for each individual <strong>market</strong> is set out on pages 22 to 79. We have included output costs (cost per square metre) and input costs (labour, materials and plant) for each type of building, shown in the local currency and in USD. Our <strong>construction</strong> costs data comes from current programmes and reflects the prices at the beginning of <strong>2016</strong>, with all costs excluding applicable taxes. We compared the average build cost in USD of six different types of <strong>construction</strong> (see figure 5), which included: ▪▪ apartment high-rise office block prestige large warehouse distribution centre general hospital primary and secondary school shopping centre including mall. Figure 5: Average cost of six building types in USD 4,000 3,500 3,000 2,500 2,000 1,500 1,000 500 0 Bangalore Warsaw Moscow Johannesburg Beijing Istanbul Nairobi Kuala Lumpur São Paulo Kampala Kigali Seoul Muscat Santiago UAE Singapore Brisbane Toronto Melbourne Munich Perth Amsterdam Paris Doha Sydney Dublin Houston Northern Ireland Scotland UK central UK north Seattle UK south Hong Kong San Francisco London New York City Zurich <strong>International</strong> <strong>construction</strong> <strong>market</strong> <strong>survey</strong> <strong>2016</strong> 13
- Page 1 and 2: International construction market s
- Page 3 and 4: Foreword The past year has seen wid
- Page 5 and 6: 5newcomers 38 global markets £500b
- Page 7 and 8: Redefining relationships with the s
- Page 9 and 10: The ripple effect of China Followin
- Page 11 and 12: The impact of currency Foreign exch
- Page 13: Figure 2: Predicted construction ma
- Page 17 and 18: Analysis Figure 6: Competition acro
- Page 19 and 20: Figure 7: Typical preliminaries (sa
- Page 21 and 22: Figure 9: The cost of labour Toront
- Page 23 and 24: International construction market s
- Page 25 and 26: International building costs, in 20
- Page 27 and 28: International building costs, in 20
- Page 29 and 30: International building costs, in 20
- Page 31 and 32: International building costs, in 20
- Page 33 and 34: International building costs, in 20
- Page 35 and 36: International building costs, in 20
- Page 37 and 38: International building costs, in 20
- Page 39 and 40: International building costs, in 20
- Page 41 and 42: International building costs, in 20
- Page 43 and 44: International building costs, in 20
- Page 45 and 46: International building costs, in 20
- Page 47 and 48: International building costs, in 20
- Page 49 and 50: International building costs, in 20
- Page 51 and 52: International building costs, in 20
- Page 53 and 54: International building costs, in 20
- Page 55 and 56: International building costs, in 20
- Page 57 and 58: International building costs, in 20
- Page 59 and 60: International building costs, in 20
- Page 61 and 62: International building costs, in 20
- Page 63 and 64: International building costs, in 20
- Page 65 and 66:
International building costs, in 20
- Page 67 and 68:
International building costs, in 20
- Page 69 and 70:
International building costs, in 20
- Page 71 and 72:
International building costs, in 20
- Page 73 and 74:
International building costs, in 20
- Page 75 and 76:
International building costs, in 20
- Page 77 and 78:
International building costs, in 20
- Page 79 and 80:
International building costs, in 20
- Page 81 and 82:
Houston USD San Francisco USD Seatt
- Page 83 and 84:
Figure 11: CBD offices - high-rise
- Page 85 and 86:
References and further reading Amer
- Page 88:
Turner & Townsend is an independent