Digital Urban Simulation : Documentation of the Teaching Results from the Autumn Semester 2015
You also want an ePaper? Increase the reach of your titles
YUMPU automatically turns print PDFs into web optimized ePapers that Google loves.
<strong>Digital</strong> <strong>Urban</strong> <strong>Simulation</strong> | Name <strong>of</strong> <strong>the</strong> project<br />
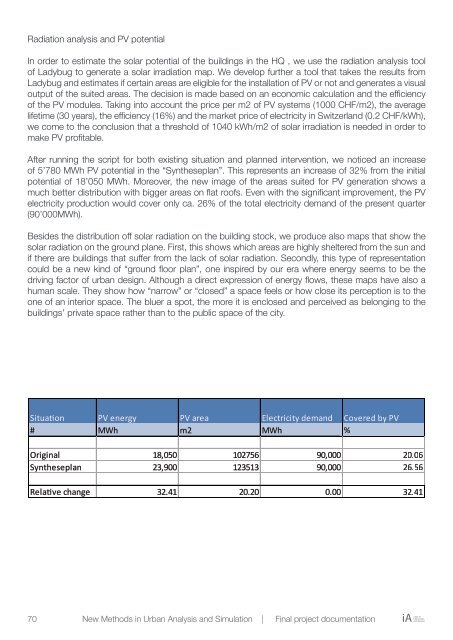
Radiation analysis and PV potential<br />
In order to estimate <strong>the</strong> solar potential <strong>of</strong> <strong>the</strong> buildings in <strong>the</strong> HQ , we use <strong>the</strong> radiation analysis tool<br />
<strong>of</strong> Ladybug to generate a solar irradiation map. We develop fur<strong>the</strong>r a tool that takes <strong>the</strong> results <strong>from</strong><br />
Ladybug and estimates if certain areas are eligible for <strong>the</strong> installation <strong>of</strong> PV or not and generates a visual<br />
output <strong>of</strong> <strong>the</strong> suited areas. The decision is made based on an economic calculation and <strong>the</strong> efficiency<br />
<strong>of</strong> <strong>the</strong> PV modules. Taking into account <strong>the</strong> price per m2 <strong>of</strong> PV systems (1000 CHF/m2), <strong>the</strong> average<br />
lifetime (30 years), <strong>the</strong> efficiency (16%) and <strong>the</strong> market price <strong>of</strong> electricity in Switzerland (0.2 CHF/kWh),<br />
Radiation we come to <strong>the</strong> analysis conclusion and that PV a threshold potential <strong>of</strong> 1040 kWh/m2 <strong>of</strong> solar irradiation is needed in order to<br />
make PV pr<strong>of</strong>itable.<br />
In order to estimate <strong>the</strong> solar potential <strong>of</strong> <strong>the</strong> buildings in <strong>the</strong> HQ , we use <strong>the</strong> radiation analysis tool <strong>of</strong> Ladybug<br />
to After generate running a solar <strong>the</strong> irradiation script for map. both We existing develop situation fur<strong>the</strong>r a tool and that planned takes <strong>the</strong> intervention, results <strong>from</strong> we Ladybug noticed and an estimates increase if<br />
certain <strong>of</strong> 5’780 areas MWh are PV eligible potential for <strong>the</strong> in installation <strong>the</strong> “Syn<strong>the</strong>seplan”. <strong>of</strong> PV or not This and represents generates a an visual increase output <strong>of</strong> <strong>of</strong> 32% <strong>the</strong> suited <strong>from</strong> areas. <strong>the</strong> initial The<br />
decision is made based on an economic calculation and <strong>the</strong> efficiency <strong>of</strong> <strong>the</strong> PV modules. Taking into account <strong>the</strong><br />
potential <strong>of</strong> 18’050 MWh. Moreover, <strong>the</strong> new image <strong>of</strong> <strong>the</strong> areas suited for PV generation shows a<br />
price per m2 <strong>of</strong> PV systems (1000 CHF/m2), <strong>the</strong> average lifetime (30 years), <strong>the</strong> efficiency cy (16%) and <strong>the</strong> market<br />
much better distribution with bigger areas on flat ro<strong>of</strong>s. Even with <strong>the</strong> significant improvement, <strong>the</strong> PV<br />
price <strong>of</strong> electricity in Switzerland (0.2 CHF/kWh), we come to <strong>the</strong> conclusion that a threshold hold <strong>of</strong> 1040 kWh/m2 <strong>of</strong><br />
electricity production would cover only ca. 26% <strong>of</strong> <strong>the</strong> total electricity demand <strong>of</strong> <strong>the</strong> present quarter<br />
solar irradiation is needed in order to make PV pr<strong>of</strong>itable.<br />
(90’000MWh).<br />
After running <strong>the</strong> script for both existing situation and planned intervention, we noticed an increase <strong>of</strong> 5’780<br />
MWh Besides PV potential <strong>the</strong> distribution in <strong>the</strong> “Syn<strong>the</strong>seplan”. <strong>of</strong>f solar radiation This represents on <strong>the</strong> building an increase stock, <strong>of</strong> we 32% produce <strong>from</strong> <strong>the</strong> also initial maps potential that show <strong>of</strong> 18’050<br />
<strong>the</strong><br />
MWh. solar radiation Moreover, on <strong>the</strong> <strong>the</strong> new ground image plane. <strong>of</strong> <strong>the</strong> First, areas this suited shows for PV which generation areas are shows highly a much sheltered better <strong>from</strong> distribution <strong>the</strong> sun with<br />
and<br />
bigger if <strong>the</strong>re areas on buildings flat ro<strong>of</strong>s. that Even suffer with <strong>from</strong> <strong>the</strong> significant <strong>the</strong> lack improvement, <strong>of</strong> solar radiation. <strong>the</strong> PV Secondly, electricity this production type <strong>of</strong> would representation<br />
cover only<br />
ca. could 26% be <strong>of</strong> <strong>the</strong> a new total kind electricity <strong>of</strong> “ground demand floor <strong>of</strong> <strong>the</strong> plan”, present one quarter inspired (90’000MWh). by our era where energy seems to be <strong>the</strong><br />
driving factor <strong>of</strong> urban design. Although a direct expression <strong>of</strong> energy flows, <strong>the</strong>se maps have also a<br />
Besides human <strong>the</strong> scale. distribution They show <strong>of</strong>f how solar “narrow” radiation on or “closed” <strong>the</strong> building a space stock, feels we produce or how also close maps its perception that show <strong>the</strong> is to solar<br />
<strong>the</strong><br />
radiation one <strong>of</strong> an on interior <strong>the</strong> ground space. plane. The First, bluer this a spot, shows <strong>the</strong> which more areas it is are enclosed highly sheltered and perceived <strong>from</strong> <strong>the</strong> as sun belonging and if <strong>the</strong>re to <strong>the</strong> are<br />
buildings’ that private suffer space <strong>from</strong> <strong>the</strong> ra<strong>the</strong>r lack than <strong>of</strong> solar to radiation. <strong>the</strong> public Secondly, space <strong>of</strong> this <strong>the</strong> type city. <strong>of</strong> representation n could be a new kind <strong>of</strong><br />
“ground floor plan”, one inspired by our era where energy seems to be <strong>the</strong> driving factor <strong>of</strong> urban design. Although<br />
a direct expression <strong>of</strong> energy flows, <strong>the</strong>se maps have also a human scale. They show how “narrow” or “closed” a<br />
space feels or how close its perception is to <strong>the</strong> one <strong>of</strong> an interior space. The bluer a spot, <strong>the</strong> more it is enclosed<br />
and perceived as belonging to <strong>the</strong> buildings’ private space ra<strong>the</strong>r than to <strong>the</strong> public space <strong>of</strong> <strong>the</strong> city.<br />
Init<br />
Sitaon PVenergy PVarea letriitydemand CoveredbyPV<br />
# MWh m2 MWh %<br />
Original 18,050 102756 90,0000 20.06<br />
Syn<strong>the</strong>seplan 23,900 123513 90,0000 26.56<br />
elavehange 32.41 20.20 0.000 32.41<br />
70<br />
New Methods in <strong>Urban</strong> Analysis and <strong>Simulation</strong> | Final project documentation<br />
Chair <strong>of</strong><br />
Information<br />
iA Architecture


