

Understanding Stocks
Understanding Stocks
Understanding Stocks

You also want an ePaper? Increase the reach of your titles
YUMPU automatically turns print PDFs into web optimized ePapers that Google loves.
112 UNDERSTANDING STOCKS<br />
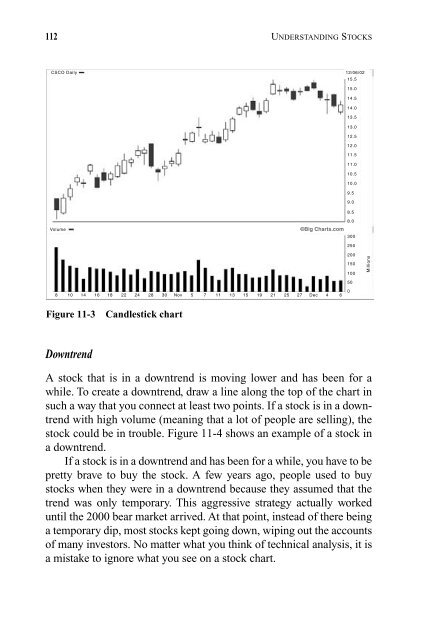
CSCO Daily<br />
Volume<br />
8 10 14 16 18 22 24 28 30 Nov 5 7 11 13 15 19 21 25 27 Dec 4 6<br />
Figure 11-3 Candlestick chart<br />
Downtrend<br />
12/06/02<br />
A stock that is in a downtrend is moving lower and has been for a<br />
while. To create a downtrend, draw a line along the top of the chart in<br />
such a way that you connect at least two points. If a stock is in a downtrend<br />
with high volume (meaning that a lot of people are selling), the<br />
stock could be in trouble. Figure 11-4 shows an example of a stock in<br />
a downtrend.<br />
If a stock is in a downtrend and has been for a while, you have to be<br />
pretty brave to buy the stock. A few years ago, people used to buy<br />
stocks when they were in a downtrend because they assumed that the<br />
trend was only temporary. This aggressive strategy actually worked<br />
until the 2000 bear market arrived. At that point, instead of there being<br />
a temporary dip, most stocks kept going down, wiping out the accounts<br />
of many investors. No matter what you think of technical analysis, it is<br />
a mistake to ignore what you see on a stock chart.<br />
15.5<br />
15.0<br />
14.5<br />
14.0<br />
13.5<br />
13.0<br />
12.5<br />
12.0<br />
11.5<br />
11.0<br />
10.5<br />
10.0<br />
9.5<br />
9.0<br />
8.5<br />
8.0<br />
©Big Charts.com<br />
300<br />
250<br />
200<br />
150<br />
100<br />
50<br />
0<br />
Millions


