

Understanding Stocks
Understanding Stocks
Understanding Stocks

You also want an ePaper? Increase the reach of your titles
YUMPU automatically turns print PDFs into web optimized ePapers that Google loves.
LET’S GET TECHNICAL: INTRODUCTION TO TECHNICAL ANALYSIS 115<br />
T Daily<br />
Volume<br />
8 10 14 16 18 22 24 28 30 Nov 5 7 11 13 15 19 21 25 27 Dec 4 6<br />
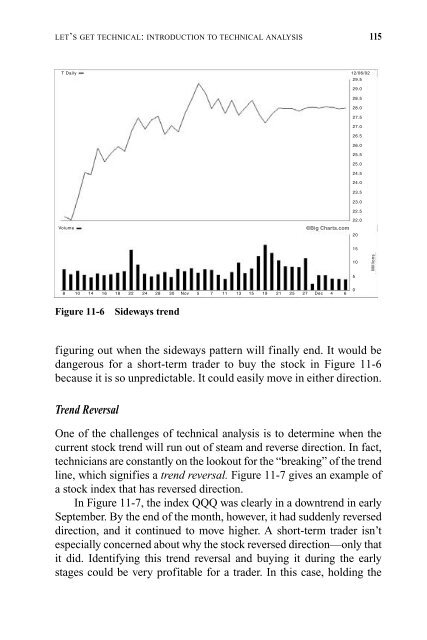
Figure 11-6 Sideways trend<br />
figuring out when the sideways pattern will finally end. It would be<br />
dangerous for a short-term trader to buy the stock in Figure 11-6<br />
because it is so unpredictable. It could easily move in either direction.<br />
Trend Reversal<br />
One of the challenges of technical analysis is to determine when the<br />
current stock trend will run out of steam and reverse direction. In fact,<br />
technicians are constantly on the lookout for the “breaking” of the trend<br />
line, which signifies a trend reversal. Figure 11-7 gives an example of<br />
a stock index that has reversed direction.<br />
In Figure 11-7, the index QQQ was clearly in a downtrend in early<br />
September. By the end of the month, however, it had suddenly reversed<br />
direction, and it continued to move higher. A short-term trader isn’t<br />
especially concerned about why the stock reversed direction—only that<br />
it did. Identifying this trend reversal and buying it during the early<br />
stages could be very profitable for a trader. In this case, holding the<br />
29.5<br />
29.0<br />
28.5<br />
28.0<br />
27.5<br />
27.0<br />
26.5<br />
26.0<br />
25.5<br />
25.0<br />
24.5<br />
24.0<br />
23.5<br />
23.0<br />
22.5<br />
22.0<br />
©Big Charts.com<br />
20<br />
12/06/02<br />
15<br />
10<br />
5<br />
0<br />
Millions


