

Understanding Stocks
Understanding Stocks
Understanding Stocks

You also want an ePaper? Increase the reach of your titles
YUMPU automatically turns print PDFs into web optimized ePapers that Google loves.
TECHNICAL ANALYSIS: TOOLS AND TACTICS 137<br />
the end, identifying that Caterpillar was oversold and would eventually<br />
reverse its downtrend.<br />
Bollinger Bands: Another Measure of Whether <strong>Stocks</strong><br />
Are Overbought or Oversold<br />
Like the RSI, Bollinger bands are an oscillator that helps traders identify<br />
whether a stock is overbought or oversold. Bollinger bands have<br />
two lines, an upper and a lower band with a gap between them that<br />
expands or contracts as the stock price moves. You should keep your<br />
eye on the third line in the middle. This is called the price indicator, and<br />
where it goes signals whether a stock is about to reverse direction. An<br />
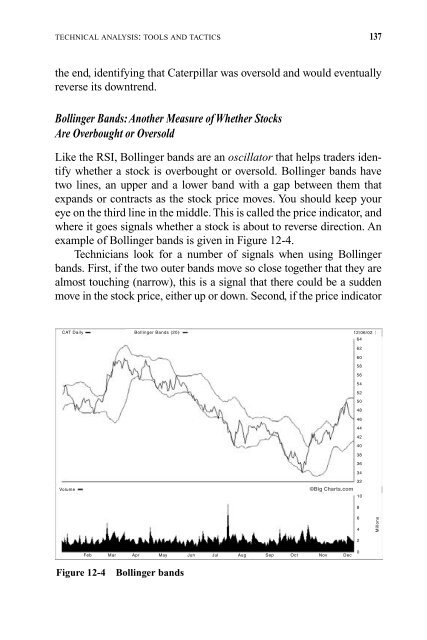
example of Bollinger bands is given in Figure 12-4.<br />
Technicians look for a number of signals when using Bollinger<br />
bands. First, if the two outer bands move so close together that they are<br />
almost touching (narrow), this is a signal that there could be a sudden<br />
move in the stock price, either up or down. Second, if the price indicator<br />
CAT Daily Bollinger Bands (20) 12/06/02<br />
64<br />
62<br />
60<br />
58<br />
56<br />
54<br />
52<br />
50<br />
48<br />
46<br />
44<br />
42<br />
40<br />
38<br />
36<br />
34<br />
32<br />
Volume ©Big Charts.com<br />
Feb Mar Apr May JunJul Aug Sep Oct Nov Dec<br />
10<br />
8<br />
6<br />
4<br />
2<br />
0<br />
Figure 12-4 Bollinger bands<br />
Millons


