

Understanding Stocks
Understanding Stocks
Understanding Stocks

Create successful ePaper yourself
Turn your PDF publications into a flip-book with our unique Google optimized e-Paper software.
136 UNDERSTANDING STOCKS<br />
CAT Daily<br />
Realative Strength Index (14)<br />
02 Feb Mar Apr May JunAug Jul<br />
Sep Oct Nov Dec<br />
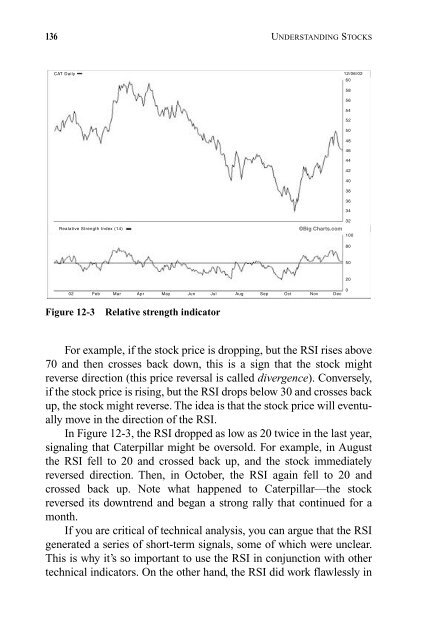
Figure 12-3 Relative strength indicator<br />
12/06/02<br />
For example, if the stock price is dropping, but the RSI rises above<br />
70 and then crosses back down, this is a sign that the stock might<br />
reverse direction (this price reversal is called divergence). Conversely,<br />
if the stock price is rising, but the RSI drops below 30 and crosses back<br />
up, the stock might reverse. The idea is that the stock price will eventually<br />
move in the direction of the RSI.<br />
In Figure 12-3, the RSI dropped as low as 20 twice in the last year,<br />
signaling that Caterpillar might be oversold. For example, in August<br />
the RSI fell to 20 and crossed back up, and the stock immediately<br />
reversed direction. Then, in October, the RSI again fell to 20 and<br />
crossed back up. Note what happened to Caterpillar—the stock<br />
reversed its downtrend and began a strong rally that continued for a<br />
month.<br />
If you are critical of technical analysis, you can argue that the RSI<br />
generated a series of short-term signals, some of which were unclear.<br />
This is why it’s so important to use the RSI in conjunction with other<br />
technical indicators. On the other hand, the RSI did work flawlessly in<br />
60<br />
58<br />
56<br />
54<br />
52<br />
50<br />
48<br />
46<br />
44<br />
42<br />
40<br />
38<br />
36<br />
34<br />
32<br />
©Big Charts.com<br />
100<br />
80<br />
50<br />
20<br />
0


