

Understanding Stocks
Understanding Stocks
Understanding Stocks

Create successful ePaper yourself
Turn your PDF publications into a flip-book with our unique Google optimized e-Paper software.
LET’S GET TECHNICAL: INTRODUCTION TO TECHNICAL ANALYSIS 121<br />
has stopped at the top of the trend, and it is about to reverse direction.<br />
Notice the head and the right and left shoulders. The point where the<br />
shoulders meet is the neckline.<br />
Analysis: The stock moves higher but pulls back to form the left<br />
shoulder. It then moves higher to form the head, which seems bullish. It<br />
then falls back to its support level or neckline, which is the alignment<br />
of the two support levels. The stock rises again to form the right shoulder<br />
but fails to break resistance. Keep your eye on the neckline, because<br />
the stock is doomed in the short term if it breaks below the neckline<br />
(which it did in Figure 11-10). The broken neckline confirms that the<br />
upward trend of the stock has been reversed.<br />
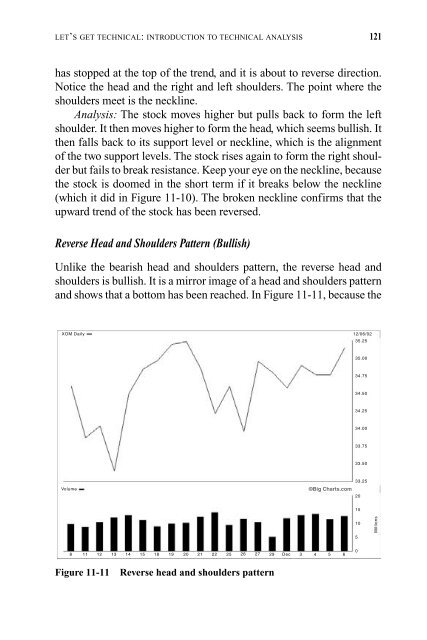
Reverse Head and Shoulders Pattern (Bullish)<br />
Unlike the bearish head and shoulders pattern, the reverse head and<br />
shoulders is bullish. It is a mirror image of a head and shoulders pattern<br />
and shows that a bottom has been reached. In Figure 11-11, because the<br />
XOM Daily<br />
Volume<br />
8 11 12 13 14 15 18 19 20 21 22 25 26 27 29 Dec 3 4 5 6<br />
Figure 11-11 Reverse head and shoulders pattern<br />
©Big Charts.com<br />
12/06/02<br />
35.25<br />
35.00<br />
34.75<br />
34.50<br />
34.25<br />
34.00<br />
33.75<br />
33.50<br />
33.25<br />
20<br />
15<br />
10<br />
5<br />
0<br />
Millions


