

Understanding Stocks
Understanding Stocks
Understanding Stocks

Create successful ePaper yourself
Turn your PDF publications into a flip-book with our unique Google optimized e-Paper software.
120 UNDERSTANDING STOCKS<br />
same mistakes—for example, buying high and selling low. Stock patterns<br />
are one tool that technicians use to evaluate what the crowds are<br />
doing. In fact, so many patterns showed up regularly on the charts that<br />
technicians began naming them.<br />
Although these chart patterns will not absolutely tell you where a<br />
stock is headed, there are signals that technicians look for to help them<br />
decide when to buy or sell. In the hands of an expert, identifying stock<br />
patterns can prevent disaster. Unfortunately, not many people can successfully<br />
recognize stock patterns until it’s too late. Nevertheless, that<br />
shouldn’t stop you from trying, since some patterns are so obvious that<br />
even a beginner can identify them in their early stages.<br />
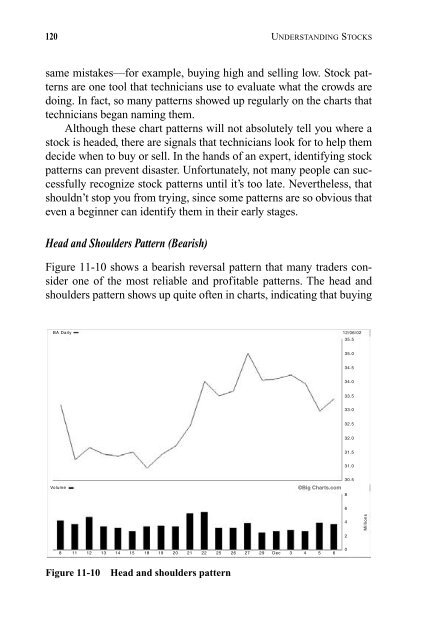
Head and Shoulders Pattern (Bearish)<br />
Figure 11-10 shows a bearish reversal pattern that many traders consider<br />
one of the most reliable and profitable patterns. The head and<br />
shoulders pattern shows up quite often in charts, indicating that buying<br />
BA Daily<br />
Volume<br />
8 11 12 13 14 15 18 19 20 21 22 25 26 27 29 Dec 3 4 5 6<br />
Figure 11-10 Head and shoulders pattern<br />
©Big Charts.com<br />
8<br />
12/06/02<br />
35.5<br />
35.0<br />
34.5<br />
34.0<br />
33.5<br />
33.0<br />
32.5<br />
32.0<br />
31.5<br />
31.0<br />
30.5<br />
6<br />
4<br />
2<br />
0<br />
Millions


