

Understanding Stocks
Understanding Stocks
Understanding Stocks

Create successful ePaper yourself
Turn your PDF publications into a flip-book with our unique Google optimized e-Paper software.
124 UNDERSTANDING STOCKS<br />
KO Hourly<br />
Volume<br />
T 10 11 12 1 2 3 4 F 10 11 12 1 2 3 4<br />
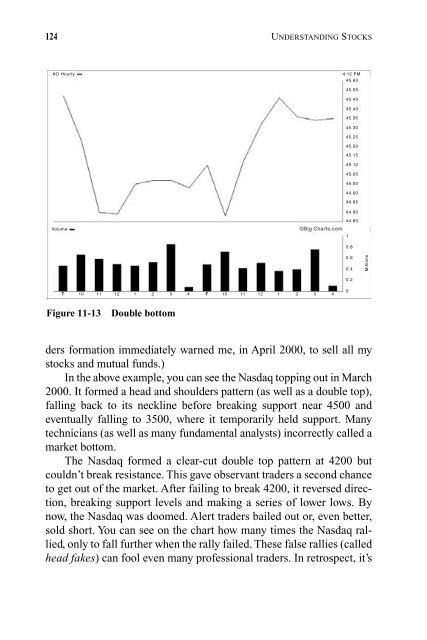
Figure 11-13 Double bottom<br />
4:12 PM<br />
45.60<br />
45.55<br />
45.45<br />
45.40<br />
45.35<br />
45.30<br />
45.25<br />
45.20<br />
ders formation immediately warned me, in April 2000, to sell all my<br />
stocks and mutual funds.)<br />
In the above example, you can see the Nasdaq topping out in March<br />
2000. It formed a head and shoulders pattern (as well as a double top),<br />
falling back to its neckline before breaking support near 4500 and<br />
eventually falling to 3500, where it temporarily held support. Many<br />
technicians (as well as many fundamental analysts) incorrectly called a<br />
market bottom.<br />
The Nasdaq formed a clear-cut double top pattern at 4200 but<br />
couldn’t break resistance. This gave observant traders a second chance<br />
to get out of the market. After failing to break 4200, it reversed direction,<br />
breaking support levels and making a series of lower lows. By<br />
now, the Nasdaq was doomed. Alert traders bailed out or, even better,<br />
sold short. You can see on the chart how many times the Nasdaq rallied,<br />
only to fall further when the rally failed. These false rallies (called<br />
head fakes) can fool even many professional traders. In retrospect, it’s<br />
45.15<br />
45.10<br />
45.05<br />
45.00<br />
44.00<br />
44.95<br />
44.90<br />
44.85<br />
©Big Charts.com<br />
1<br />
0.8<br />
0.6<br />
0.4<br />
0.2<br />
0<br />
Millions


