

Understanding Stocks
Understanding Stocks
Understanding Stocks

You also want an ePaper? Increase the reach of your titles
YUMPU automatically turns print PDFs into web optimized ePapers that Google loves.
134 UNDERSTANDING STOCKS<br />
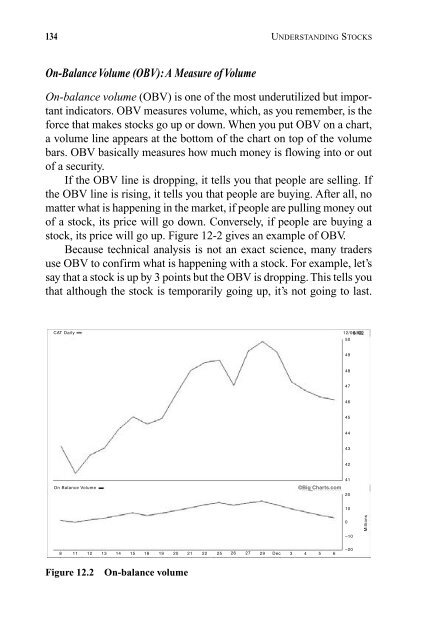
On-Balance Volume (OBV): A Measure of Volume<br />
On-balance volume (OBV) is one of the most underutilized but important<br />
indicators. OBV measures volume, which, as you remember, is the<br />
force that makes stocks go up or down. When you put OBV on a chart,<br />
a volume line appears at the bottom of the chart on top of the volume<br />
bars. OBV basically measures how much money is flowing into or out<br />
of a security.<br />
If the OBV line is dropping, it tells you that people are selling. If<br />
the OBV line is rising, it tells you that people are buying. After all, no<br />
matter what is happening in the market, if people are pulling money out<br />
of a stock, its price will go down. Conversely, if people are buying a<br />
stock, its price will go up. Figure 12-2 gives an example of OBV.<br />
Because technical analysis is not an exact science, many traders<br />
use OBV to confirm what is happening with a stock. For example, let’s<br />
say that a stock is up by 3 points but the OBV is dropping. This tells you<br />
that although the stock is temporarily going up, it’s not going to last.<br />
CAT Daily<br />
On Balance Volume<br />
8 11 12 13 14 15 18 19 20 21 22 25 26 27 29 Dec 3 4 5 6<br />
Figure 12.2 On-balance volume<br />
©Big Charts.com<br />
12/06/02<br />
50<br />
49<br />
48<br />
47<br />
46<br />
45<br />
44<br />
43<br />
42<br />
41<br />
20<br />
10<br />
0<br />
–10<br />
–20<br />
Millions


