

Understanding Stocks
Understanding Stocks
Understanding Stocks

You also want an ePaper? Increase the reach of your titles
YUMPU automatically turns print PDFs into web optimized ePapers that Google loves.
LET’S GET TECHNICAL: INTRODUCTION TO TECHNICAL ANALYSIS 113<br />
ERICY Weekly<br />
Volume<br />
Uptrend<br />
02 Feb Mar Apr May JunAug Jul<br />
Sep Oct Nov Dec<br />
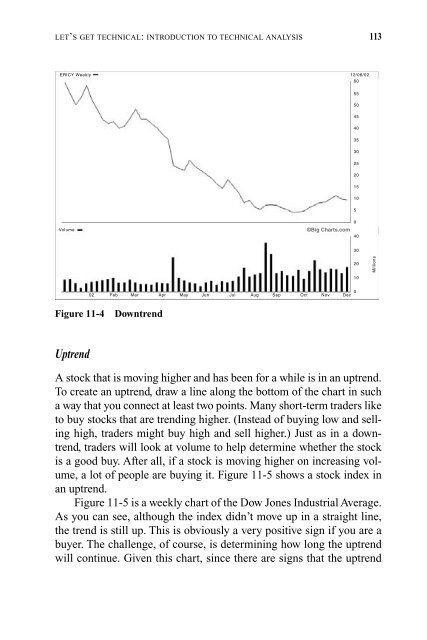
Figure 11-4 Downtrend<br />
12/06/02<br />
60<br />
A stock that is moving higher and has been for a while is in an uptrend.<br />
To create an uptrend, draw a line along the bottom of the chart in such<br />
a way that you connect at least two points. Many short-term traders like<br />
to buy stocks that are trending higher. (Instead of buying low and selling<br />
high, traders might buy high and sell higher.) Just as in a downtrend,<br />
traders will look at volume to help determine whether the stock<br />
is a good buy. After all, if a stock is moving higher on increasing volume,<br />
a lot of people are buying it. Figure 11-5 shows a stock index in<br />
an uptrend.<br />
Figure 11-5 is a weekly chart of the Dow Jones Industrial Average.<br />
As you can see, although the index didn’t move up in a straight line,<br />
the trend is still up. This is obviously a very positive sign if you are a<br />
buyer. The challenge, of course, is determining how long the uptrend<br />
will continue. Given this chart, since there are signs that the uptrend<br />
55<br />
50<br />
45<br />
40<br />
35<br />
30<br />
25<br />
20<br />
15<br />
10<br />
5<br />
0<br />
©Big Charts.com<br />
40<br />
30<br />
20<br />
10<br />
0<br />
Millions


