20645_Scapa_AR_160504

Create successful ePaper yourself
Turn your PDF publications into a flip-book with our unique Google optimized e-Paper software.
FIVE YE<strong>AR</strong> SUMM<strong>AR</strong>IES<br />
FINANCIAL STATEMENTS<br />
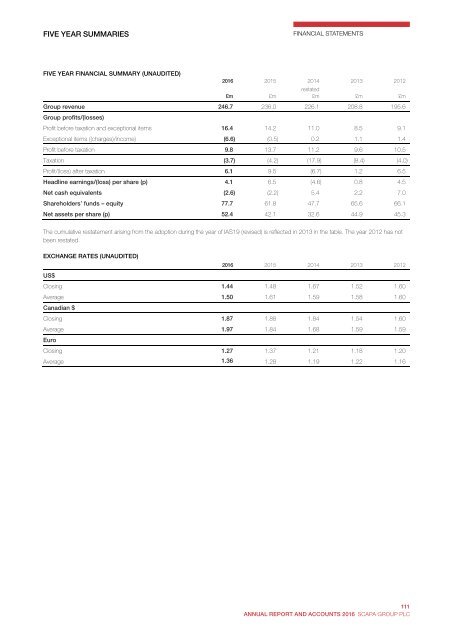
FIVE YE<strong>AR</strong> FINANCIAL SUMM<strong>AR</strong>Y (UNAUDITED)<br />
2016<br />
£m<br />
2015<br />
£m<br />
2014<br />
restated<br />
£m<br />
Group revenue 246.7 236.0 226.1 208.8 195.6<br />
Group profits/(losses)<br />
Profit before taxation and exceptional items 16.4 14.2 11.0 8.5 9.1<br />
Exceptional items ((charges)/income) (6.6) (0.5) 0.2 1.1 1.4<br />
Profit before taxation 9.8 13.7 11.2 9.6 10.5<br />
Taxation (3.7) (4.2) (17.9) (8.4) (4.0)<br />
Profit/(loss) after taxation 6.1 9.5 (6.7) 1.2 6.5<br />
Headline earnings/(loss) per share (p) 4.1 6.5 (4.6) 0.8 4.5<br />
Net cash equivalents (2.6) (2.2) 5.4 2.2 7.0<br />
Shareholders’ funds – equity 77.7 61.8 47.7 65.6 66.1<br />
Net assets per share (p) 52.4 42.1 32.6 44.9 45.3<br />
2013<br />
£m<br />
2012<br />
£m<br />
The cumulative restatement arising from the adoption during the year of IAS19 (revised) is reflected in 2013 in the table. The year 2012 has not<br />
been restated.<br />
EXCHANGE RATES (UNAUDITED)<br />
2016 2015 2014 2013 2012<br />
US$<br />
Closing 1.44 1.48 1.67 1.52 1.60<br />
Average 1.50 1.61 1.59 1.58 1.60<br />
Canadian $<br />
Closing 1.87 1.88 1.84 1.54 1.60<br />
Average 1.97 1.84 1.68 1.59 1.59<br />
Euro<br />
Closing 1.27 1.37 1.21 1.18 1.20<br />
Average 1.36 1.28 1.19 1.22 1.16<br />
106<br />
<strong>Scapa</strong> Group plc Annual Report and Accounts 2016<br />
111<br />
ANNUAL REPORT AND ACCOUNTS 2016 SCAPA GROUP PLC