20645_Scapa_AR_160504

Create successful ePaper yourself
Turn your PDF publications into a flip-book with our unique Google optimized e-Paper software.
NOTES ON THE ACCOUNTS CONTINUED<br />
FINANCIAL STATEMENTS<br />
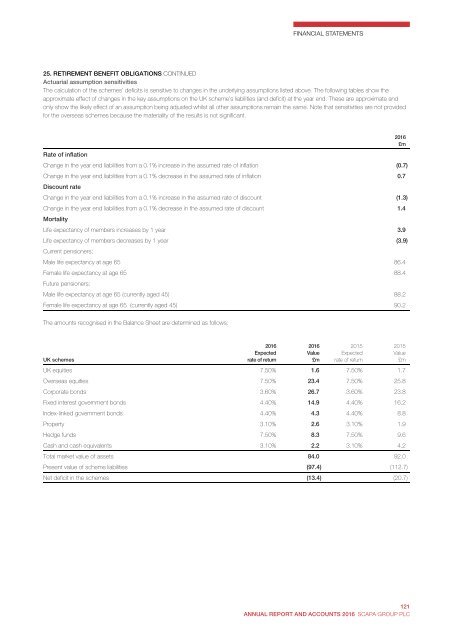
25. RETIREMENT BENEFIT OBLIGATIONS CONTINUED<br />
Actuarial assumption sensitivities<br />
The calculation of the schemes’ deficits is sensitive to changes in the underlying assumptions listed above. The following tables show the<br />
approximate effect of changes in the key assumptions on the UK scheme’s liabilities (and deficit) at the year end. These are approximate and<br />
only show the likely effect of an assumption being adjusted whilst all other assumptions remain the same. Note that sensitivities are not provided<br />
for the overseas schemes because the materiality of the results is not significant.<br />
Rate of inflation<br />
Change in the year end liabilities from a 0.1% increase in the assumed rate of inflation (0.7)<br />
Change in the year end liabilities from a 0.1% decrease in the assumed rate of inflation 0.7<br />
Discount rate<br />
Change in the year end liabilities from a 0.1% increase in the assumed rate of discount (1.3)<br />
Change in the year end liabilities from a 0.1% decrease in the assumed rate of discount 1.4<br />
Mortality<br />
Life expectancy of members increases by 1 year 3.9<br />
Life expectancy of members decreases by 1 year (3.9)<br />
Current pensioners:<br />
Male life expectancy at age 65 86.4<br />
Female life expectancy at age 65 88.4<br />
Future pensioners:<br />
Male life expectancy at age 65 (currently aged 45) 88.2<br />
Female life expectancy at age 65 (currently aged 45) 90.2<br />
2016<br />
£m<br />
The amounts recognised in the Balance Sheet are determined as follows:<br />
UK schemes<br />
2016<br />
Expected<br />
rate of return<br />
2016<br />
Value<br />
£m<br />
2015<br />
Expected<br />
rate of return<br />
2015<br />
Value<br />
£m<br />
UK equities 7.50% 1.6 7.50% 1.7<br />
Overseas equities 7.50% 23.4 7.50% 25.8<br />
Corporate bonds 3.60% 26.7 3.60% 23.8<br />
Fixed interest government bonds 4.40% 14.9 4.40% 16.2<br />
Index-linked government bonds 4.40% 4.3 4.40% 8.8<br />
Property 3.10% 2.6 3.10% 1.9<br />
Hedge funds 7.50% 8.3 7.50% 9.6<br />
Cash and cash equivalents 3.10% 2.2 3.10% 4.2<br />
Total market value of assets 84.0 92.0<br />
Present value of scheme liabilities (97.4) (112.7)<br />
Net deficit in the schemes (13.4) (20.7)<br />
116<br />
<strong>Scapa</strong> Group plc Annual Report and Accounts 2016<br />
121<br />
ANNUAL REPORT AND ACCOUNTS 2016 SCAPA GROUP PLC