20645_Scapa_AR_160504

Create successful ePaper yourself
Turn your PDF publications into a flip-book with our unique Google optimized e-Paper software.
CORPORATE GOVERNANCE<br />
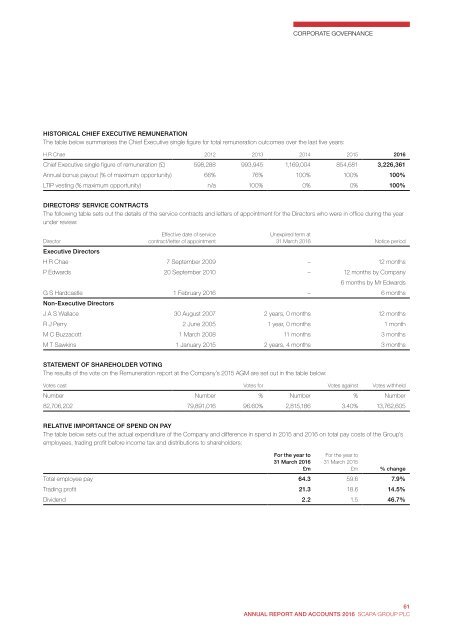
HISTORICAL CHIEF EXECUTIVE REMUNERATION<br />
The table below summarises the Chief Executive single figure for total remuneration outcomes over the last five years:<br />
H R Chae 2012 2013 2014 2015 2016<br />
Chief Executive single figure of remuneration (£) 598,288 993,945 1,169,004 854,681 3,226,361<br />
Annual bonus payout (% of maximum opportunity) 66% 76% 100% 100% 100%<br />
LTIP vesting (% maximum opportunity) n/a 100% 0% 0% 100%<br />
DIRECTORS’ SERVICE CONTRACTS<br />
The following table sets out the details of the service contracts and letters of appointment for the Directors who were in office during the year<br />
under review:<br />
Director<br />
Effective date of service<br />
contract/letter of appointment<br />
Unexpired term at<br />
31 March 2016 Notice period<br />
Executive Directors<br />
H R Chae 7 September 2009 – 12 months<br />
P Edwards 20 September 2010 – 12 months by Company<br />
6 months by Mr Edwards<br />
G S Hardcastle 1 February 2016 – 6 months<br />
Non-Executive Directors<br />
J A S Wallace 30 August 2007 2 years, 0 months 12 months<br />
R J Perry 2 June 2005 1 year, 0 months 1 month<br />
M C Buzzacott 1 March 2008 11 months 3 months<br />
M T Sawkins 1 January 2015 2 years, 4 months 3 months<br />
STATEMENT OF SH<strong>AR</strong>EHOLDER VOTING<br />
The results of the vote on the Remuneration report at the Company’s 2015 AGM are set out in the table below:<br />
Votes cast Votes for Votes against Votes withheld<br />
Number Number % Number % Number<br />
82,706,202 79,891,016 96.60% 2,815,186 3.40% 13,762,605<br />
RELATIVE IMPORTANCE OF SPEND ON PAY<br />
The table below sets out the actual expenditure of the Company and difference in spend in 2015 and 2016 on total pay costs of the Group’s<br />
employees, trading profit before income tax and distributions to shareholders:<br />
For the year to<br />
31 March 2016<br />
£m<br />
For the year to<br />
31 March 2015<br />
£m % change<br />
Total employee pay 64.3 59.6 7.9%<br />
Trading profit 21.3 18.6 14.5%<br />
Dividend 2.2 1.5 46.7%<br />
61<br />
ANNUAL REPORT AND ACCOUNTS 2016 SCAPA GROUP PLC