20645_Scapa_AR_160504

You also want an ePaper? Increase the reach of your titles
YUMPU automatically turns print PDFs into web optimized ePapers that Google loves.
STRATEGIC REPORT<br />
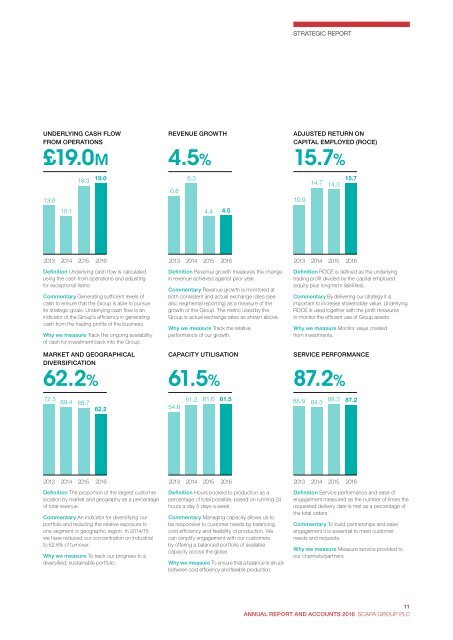
UNDERLYING CASH FLOW<br />
FROM OPERATIONS<br />
£19.0M<br />
13.0<br />
10.1<br />
18.3 19.0<br />
REVENUE GROWTH<br />
4.5%<br />
8.3<br />
6.8<br />
4.4 4.5<br />
ADJUSTED RETURN ON<br />
CAPITAL EMPLOYED (ROCE)<br />
15.7%<br />
10.9<br />
14.7 14.3<br />
15.7<br />
2013 2014 2015 2016<br />
Definition Underlying cash flow is calculated<br />
using the cash from operations and adjusting<br />
for exceptional items.<br />
Commentary Generating sufficient levels of<br />
cash to ensure that the Group is able to pursue<br />
its strategic goals. Underlying cash flow is an<br />
indicator of the Group’s efficiency in generating<br />
cash from the trading profits of the business.<br />
Why we measure Track the ongoing availability<br />
of cash for investment back into the Group.<br />
M<strong>AR</strong>KET AND GEOGRAPHICAL<br />
DIVERSIFICATION<br />
62.2%<br />
72.5 69.4 68.7<br />
62.2<br />
2013 2014 2015 2016<br />
Definition Revenue growth measures the change<br />
in revenue achieved against prior year.<br />
Commentary Revenue growth is monitored at<br />
both consistent and actual exchange rates (see<br />
also segmental reporting) as a measure of the<br />
growth of the Group. The metric used by the<br />
Group is actual exchange rates as shown above.<br />
Why we measure Track the relative<br />
performance of our growth.<br />
CAPACITY UTILISATION<br />
61.5%<br />
54.8<br />
61.2 61.6 61.5<br />
2013 2014 2015 2016<br />
Definition ROCE is defined as the underlying<br />
trading profit divided by the capital employed<br />
(equity plus long-term liabilities).<br />
Commentary By delivering our strategy it is<br />
important to increase shareholder value. Underlying<br />
ROCE is used together with the profit measures<br />
to monitor the efficient use of Group assets.<br />
Why we measure Monitor value created<br />
from investments.<br />
SERVICE PERFORMANCE<br />
87.2%<br />
85.9 84.3 88.3 87.2<br />
2013 2014 2015 2016<br />
Definition The proportion of the largest customer<br />
location by market and geography as a percentage<br />
of total revenue.<br />
Commentary An indicator for diversifying our<br />
portfolio and reducing the relative exposure to<br />
one segment or geographic region. In 2014/15<br />
we have reduced our concentration on Industrial<br />
to 62.6% of turnover.<br />
Why we measure To track our progress to a<br />
diversified, sustainable portfolio.<br />
2013 2014 2015 2016<br />
Definition Hours booked to production as a<br />
percentage of total possible, based on running 24<br />
hours a day 5 days a week.<br />
Commentary Managing capacity allows us to<br />
be responsive to customer needs by balancing<br />
cost efficiency and flexibility of production. We<br />
can simplify engagement with our customers<br />
by offering a balanced portfolio of available<br />
capacity across the globe.<br />
Why we measure To ensure that a balance is struck<br />
between cost efficiency and flexible production.<br />
2013 2014 2015 2016<br />
Definition Service performance and ease of<br />
engagement measured as the number of times the<br />
requested delivery date is met as a percentage of<br />
the total orders<br />
Commentary To build partnerships and ease<br />
engagement it is essential to meet customer<br />
needs and requests.<br />
Why we measure Measure service provided to<br />
our channels/partners<br />
11<br />
ANNUAL REPORT AND ACCOUNTS 2016 SCAPA GROUP PLC