20645_Scapa_AR_160504

Create successful ePaper yourself
Turn your PDF publications into a flip-book with our unique Google optimized e-Paper software.
NOTES ON ON THE THE ACCOUNTS<br />
FINANCIAL STATEMENTS<br />
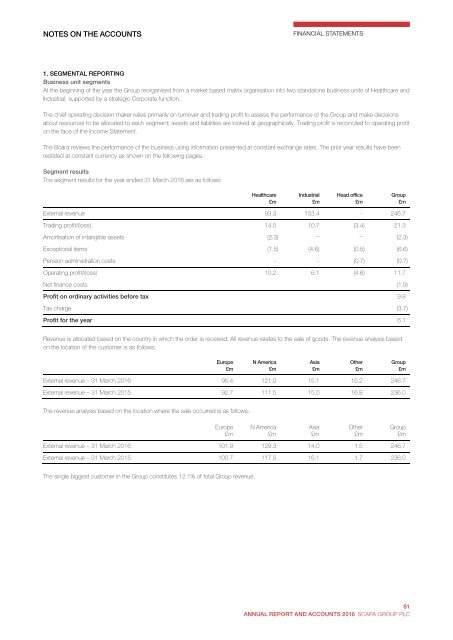
1. SEGMENTAL REPORTING<br />
Business unit segments<br />
At the beginning of the year the Group reorganised from a market based matrix organisation into two standalone business units of Healthcare and<br />
Industrial, supported by a strategic Corporate function.<br />
The chief operating decision maker relies primarily on turnover and trading profit to assess the performance of the Group and make decisions<br />
about resources to be allocated to each segment; assets and liabilities are looked at geographically. Trading profit is reconciled to operating profit<br />
on the face of the Income Statement.<br />
The Board reviews the performance of the business using information presented at constant exchange rates. The prior year results have been<br />
restated at constant currency as shown on the following pages.<br />
Segment results<br />
The segment results for the year ended 31 March 2016 are as follows:<br />
Healthcare<br />
£m<br />
Industrial<br />
£m<br />
Head office<br />
£m<br />
Group<br />
£m<br />
External revenue 93.3 153.4 - 246.7<br />
Trading profit/(loss) 14.0 10.7 (3.4) 21.3<br />
Amortisation of intangible assets (2.3) – – (2.3)<br />
Exceptional items (1.5) (4.6) (0.5) (6.6)<br />
Pension administration costs - - (0.7) (0.7)<br />
Operating profit/(loss) 10.2 6.1 (4.6) 11.7<br />
Net finance costs (1.9)<br />
Profit on ordinary activities before tax 9.8<br />
Tax charge (3.7)<br />
Profit for the year 6.1<br />
Revenue is allocated based on the country in which the order is received. All revenue relates to the sale of goods. The revenue analysis based<br />
on the location of the customer is as follows:<br />
Europe<br />
£m<br />
N America<br />
£m<br />
Asia<br />
£m<br />
Other<br />
£m<br />
Group<br />
£m<br />
External revenue – 31 March 2016 95.4 121.0 15.1 15.2 246.7<br />
External revenue – 31 March 2015 92.7 111.5 15.0 16.8 236.0<br />
The revenue analysis based on the location where the sale occurred is as follows:<br />
Europe<br />
£m<br />
N America<br />
£m<br />
External revenue – 31 March 2016 101.9 129.3 14.0 1.5 246.7<br />
External revenue – 31 March 2015 100.7 117.5 16.1 1.7 236.0<br />
Asia<br />
£m<br />
Other<br />
£m<br />
Group<br />
£m<br />
The single biggest customer in the Group constitutes 12.1% of total Group revenue.<br />
76<br />
<strong>Scapa</strong> Group plc Annual Report and Accounts 2016<br />
81<br />
ANNUAL REPORT AND ACCOUNTS 2016 SCAPA GROUP PLC