- Page 1 and 2: NATIONAL RESEARCH FOUNDATION ANNUAL
- Page 3 and 4: STATEMENT OF RESPONSIBILITY To the
- Page 5 and 6: 7. PROGRAMME 1 (CORPORATE): STRATEG
- Page 7 and 8: 13. KEY PERFORMANCE INDICATOR REPOR
- Page 9 and 10: The year ahead The penultimate year
- Page 11 and 12: ocwaningweni, abacwaningi kanye nok
- Page 13 and 14: Boto e dumela tlhohlo yeo e amanago
- Page 15 and 16: Towards the goal of providing “Le
- Page 17 and 18: UMBIKO OFINGQAYO WESIKHULU ESIPHEZU
- Page 19 and 20: Ngeshwa inhlangano yamemezela ukuse
- Page 21 and 22: Palomoka ya banyakišiši ba 4700 i
- Page 23 and 24: PART A: STRATEGIC OVERVIEW NRF Annu
- Page 25 and 26: PART A: STRATEGIC OVERVIEW 1.1.2 NR
- Page 27 and 28: PART A: STRATEGIC OVERVIEW 2 LEGISL
- Page 29 and 30: PART A: STRATEGIC OVERVIEW 2.3.1 Ac
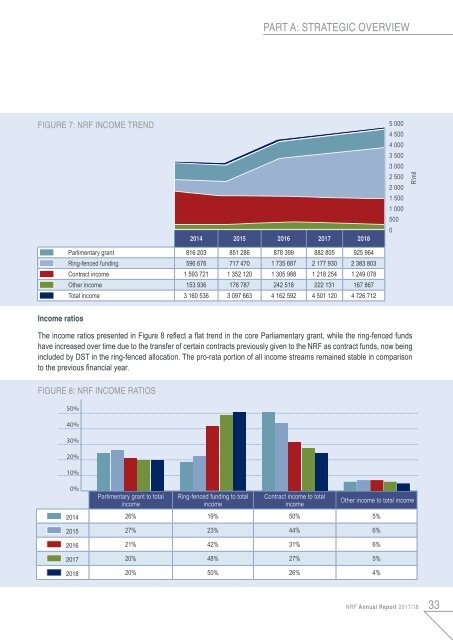
- Page 31: PART A: STRATEGIC OVERVIEW 3.2 Orga
- Page 35 and 36: PART A: STRATEGIC OVERVIEW FIGURE 9
- Page 37 and 38: PART A: STRATEGIC OVERVIEW FIGURE 1
- Page 39 and 40: PART A: STRATEGIC OVERVIEW PART B:
- Page 41 and 42: PART B: PERFORMANCE The NRF dischar
- Page 43 and 44: PART B: PERFORMANCE international S
- Page 45 and 46: PART B: PERFORMANCE 6 NRF RESPONSE
- Page 47 and 48: PART B: PERFORMANCE FIGURE 16: NRF
- Page 49 and 50: PART B: PERFORMANCE 7 PROGRAMME 1 (
- Page 51 and 52: PART B: PERFORMANCE • Assistance
- Page 53 and 54: PART B: PERFORMANCE Association (SA
- Page 55 and 56: PART B: PERFORMANCE 7.3 Performance
- Page 57 and 58: PART B: PERFORMANCE 3A public entit
- Page 59 and 60: PART B: PERFORMANCE 7.4 Performance
- Page 61 and 62: PART B: PERFORMANCE Proportion of s
- Page 63 and 64: PART B: PERFORMANCE 8 PROGRAMME 2:
- Page 65 and 66: PART B: PERFORMANCE introduction to
- Page 67 and 68: PART B: PERFORMANCE encourage them
- Page 69 and 70: PART B: PERFORMANCE • SAASTA Scie
- Page 71 and 72: PART B: PERFORMANCE 9 PROGRAMME 3 (
- Page 73 and 74: PART B: PERFORMANCE Next generation
- Page 75 and 76: PART B: PERFORMANCE Centres of Exce
- Page 77 and 78: PART B: PERFORMANCE TABLE 11: PERFO
- Page 79 and 80: PART B: PERFORMANCE South Africa/Me
- Page 81 and 82: PART B: PERFORMANCE 9.4 Performance
- Page 83 and 84:
PART B: PERFORMANCE It is evident f
- Page 85 and 86:
PART B: PERFORMANCE 9.5 Performance
- Page 87 and 88:
PART B: PERFORMANCE 9.6 Special pro
- Page 89 and 90:
PART B: PERFORMANCE The schematic r
- Page 91 and 92:
PART B: PERFORMANCE 10.1 Nuclear sc
- Page 93 and 94:
PART B: PERFORMANCE Knowledge gener
- Page 95 and 96:
PART B: PERFORMANCE Enhance strateg
- Page 97 and 98:
PART B: PERFORMANCE GNU compiler co
- Page 99 and 100:
PART B: PERFORMANCE 10.3.2 South Af
- Page 101 and 102:
PART B: PERFORMANCE 10.4 Biodiversi
- Page 103 and 104:
PART B: PERFORMANCE and hosted by t
- Page 105 and 106:
PART B: PERFORMANCE 10.4.2 Enhance
- Page 107 and 108:
PART B: PERFORMANCE 10.4.3 Establis
- Page 109 and 110:
PART B: PERFORMANCE 10.5 Astronomy
- Page 111 and 112:
PART B: PERFORMANCE 10.6 Astronomy
- Page 113 and 114:
PART B: PERFORMANCE TABLE 22: ASTRO
- Page 115 and 116:
PART B: PERFORMANCE MeerKAT The hig
- Page 117 and 118:
PART B: PERFORMANCE 10.6.3 Establis
- Page 119 and 120:
PART C: REGULATORY REPORTING NRF An
- Page 121 and 122:
PART C: REGULATORY REPORTING 11.5 N
- Page 123 and 124:
PART C: REGULATORY REPORTING 11.10
- Page 125 and 126:
PART C: REGULATORY REPORTING 11.12
- Page 127 and 128:
PART C: REGULATORY REPORTING 11.12.
- Page 129 and 130:
PART C: REGULATORY REPORTING FIGURE
- Page 131 and 132:
PART C: REGULATORY REPORTING • Ev
- Page 133 and 134:
PART C: REGULATORY REPORTING • Go
- Page 135 and 136:
PART C: REGULATORY REPORTING TABLE
- Page 137 and 138:
PART C: REGULATORY REPORTING NRF st
- Page 139 and 140:
PART C: REGULATORY REPORTING 12.2.3
- Page 141 and 142:
PART C: REGULATORY REPORTING 12.2.5
- Page 143 and 144:
PART C: REGULATORY REPORTING 12.2.7
- Page 145 and 146:
PART C: REGULATORY REPORTING 13.3 K
- Page 147 and 148:
PART C: REGULATORY REPORTING INDICA
- Page 149 and 150:
PART C: REGULATORY REPORTING 14 ALI
- Page 151 and 152:
PART D: ANNUAL FINANCIAL STATEMENTS
- Page 153 and 154:
PART D: ANNUAL FINANCIAL PART D: AN
- Page 155 and 156:
PART D: ANNUAL FINANCIAL STATEMENTS
- Page 157 and 158:
PART D: ANNUAL FINANCIAL STATEMENTS
- Page 159 and 160:
PART D: ANNUAL FINANCIAL STATEMENTS
- Page 161 and 162:
PART D: ANNUAL FINANCIAL STATEMENTS
- Page 163 and 164:
PART D: ANNUAL FINANCIAL STATEMENTS
- Page 165 and 166:
PART D: ANNUAL FINANCIAL STATEMENTS
- Page 167 and 168:
PART D: ANNUAL FINANCIAL STATEMENTS
- Page 169 and 170:
PART D: ANNUAL FINANCIAL STATEMENTS
- Page 171 and 172:
PART D: ANNUAL FINANCIAL STATEMENTS
- Page 173 and 174:
PART D: ANNUAL FINANCIAL STATEMENTS
- Page 175 and 176:
PART D: ANNUAL FINANCIAL STATEMENTS
- Page 177 and 178:
PART D: ANNUAL FINANCIAL STATEMENTS
- Page 179 and 180:
PART D: ANNUAL FINANCIAL STATEMENTS
- Page 181 and 182:
PART D: ANNUAL FINANCIAL STATEMENTS
- Page 183 and 184:
PART D: ANNUAL FINANCIAL STATEMENTS
- Page 185 and 186:
PART D: ANNUAL FINANCIAL STATEMENTS
- Page 187 and 188:
PART D: ANNUAL FINANCIAL STATEMENTS
- Page 189 and 190:
PART D: ANNUAL FINANCIAL STATEMENTS
- Page 191 and 192:
PART D: ANNUAL FINANCIAL STATEMENTS
- Page 193 and 194:
PART D: ANNUAL FINANCIAL STATEMENTS
- Page 195 and 196:
PART D: ANNUAL FINANCIAL STATEMENTS
- Page 197 and 198:
PART D: ANNUAL FINANCIAL STATEMENTS
- Page 199 and 200:
PART D: ANNUAL FINANCIAL STATEMENTS
- Page 201 and 202:
PART D: ANNUAL FINANCIAL STATEMENTS
- Page 203 and 204:
PART D: ANNUAL FINANCIAL STATEMENTS
- Page 205 and 206:
PART D: ANNUAL FINANCIAL STATEMENTS
- Page 207 and 208:
PART D: ANNUAL FINANCIAL STATEMENTS
- Page 209 and 210:
PART D: ANNUAL FINANCIAL STATEMENTS
- Page 211 and 212:
PART D: ANNUAL FINANCIAL STATEMENTS
- Page 213 and 214:
PART D: ANNUAL FINANCIAL STATEMENTS
- Page 215 and 216:
PART D: ANNUAL FINANCIAL STATEMENTS
- Page 217 and 218:
PART D: ANNUAL FINANCIAL STATEMENTS
- Page 219 and 220:
PART D: ANNUAL FINANCIAL STATEMENTS
- Page 221 and 222:
PART D: ANNUAL FINANCIAL STATEMENTS